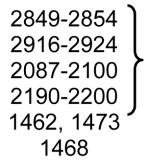
Table 1.
IR modes used for analysis of IRRAS spectra
| Mode | Wavenumber (cm-1) |
Comments |
|---|---|---|
| Lipids | ||
| Acyl chain modes | ||
| CH2 symmetric stretch |

|
The frequencies of these modes are qualitative markers of conformational disorder |
| CH2 asymmetric stretch | ||
| CD2 symmetric stretch | ||
| CD2 asymmetric stretch | ||
| CH2 scissoring | Orthorhombic phase doublet Hexagonal or triclinic phase |
|
| CD2 scissoring | 1086, 1094 1089 |
Orthorhombic phase doublet Hexagonal or triclinic phase |
| Polar region modes | ||
| C=O stretch (ester) | 1710-1740 | The frequency is sensitive to H-bonding |
| C=O stretch (fatty acid) | 1690-1740 | The frequency is sensitive to protonation state |
| PO2− asymmetric stretch | 1220-1250 | The frequency is sensitive to hydration and ion binding |
| PO2− symmetric stretch | ~1090 | |
| Peptide bond modes | ||
| Amide I (mostly C=O stretch) |
1610-1690 | The frequency is sensitive to secondary structure and vibrational coupling |
| Amide II (N-H in-plane bend + C-N stretch) |
1520-1560 | Commonly used to monitor H-D exchange. The frequency is sensitive to secondary structure |
| Amide A (N-H stretch) | 3200-3400 | Secondary structure sensitivity is limited |
