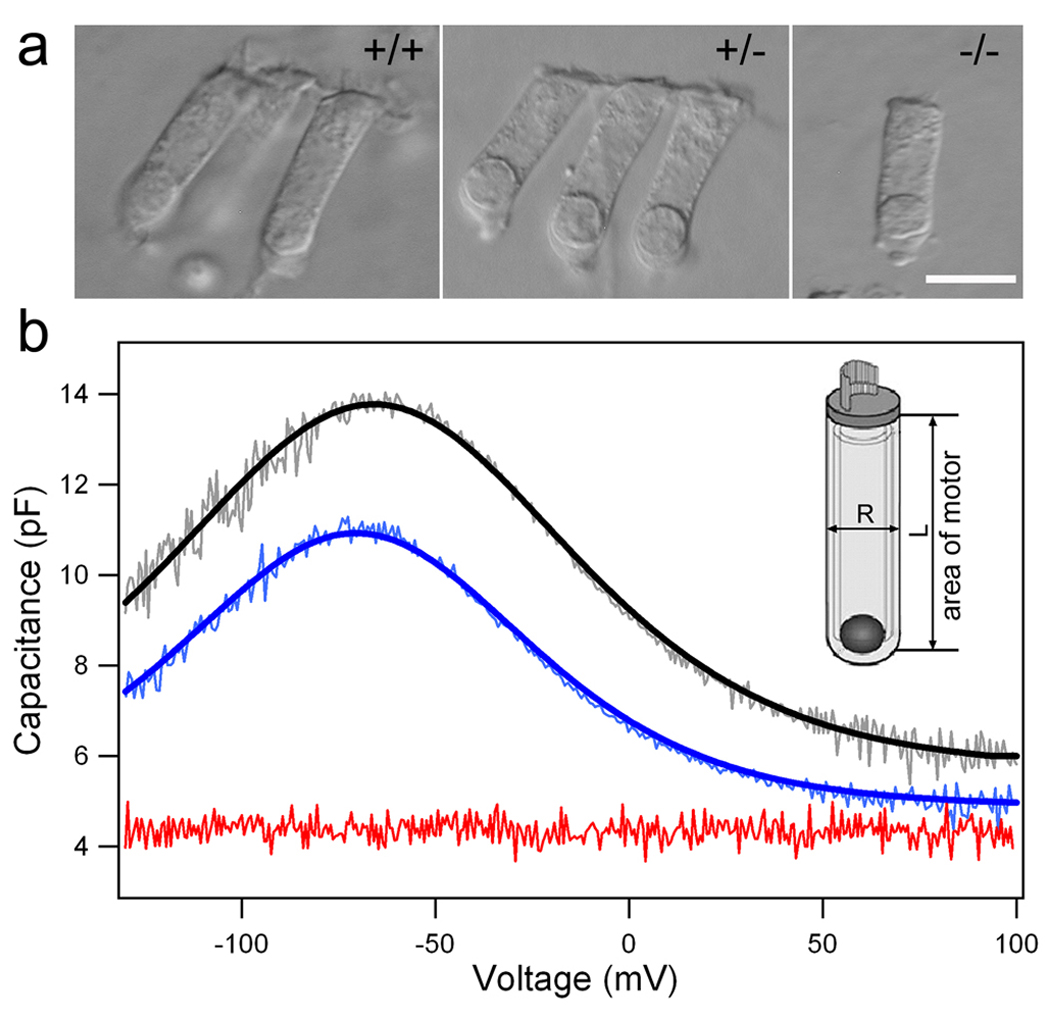
Figure 1.

Nonlinear capacitance (NLC) and ‘gating’ charge density measured from OHCs isolated from WT (+/+), heterozygous (+/−), and prestin-null (−/−) mice. (a) Images of isolated OHCs from the three genotypes. (b) Examples of the NLC measured from the three populations of OHCs. The NLC (lighter color lines) was fit with a two-state Boltzmann function (heavy lines). The NLC is color-coded; WT in black, heterozygous in blue, and prestin-null in red. The 6 parameters obtained from these cells are: Qmax 978.9±182.6 fC, α 31.1±4.9 mV−1, z 0.79±0.12, V1/2 −65.2±29.4 mV, Cnon-lin 7.9±1.6 pF, Clin 5.69±0.83 pF (for +/+, n=23); Qmax 720.1±159.6 fC, α 30.5±4.9 mV−1, z 0.78±0.12, V1/2 −68.9±33.9 mV, Cnon-lin 5.9±0.86 pF, Clin 5.39±0.55 pF (for +/−, n=22). The linear capacitance (Clin) for homozygous OHCs is 4.8±0.34 pF (n=5). (b, inset) Schematic drawing of an OHC illustrates how the total plasma membrane area containing prestin is calculated. Magnification bar in a equals 10 µm.
