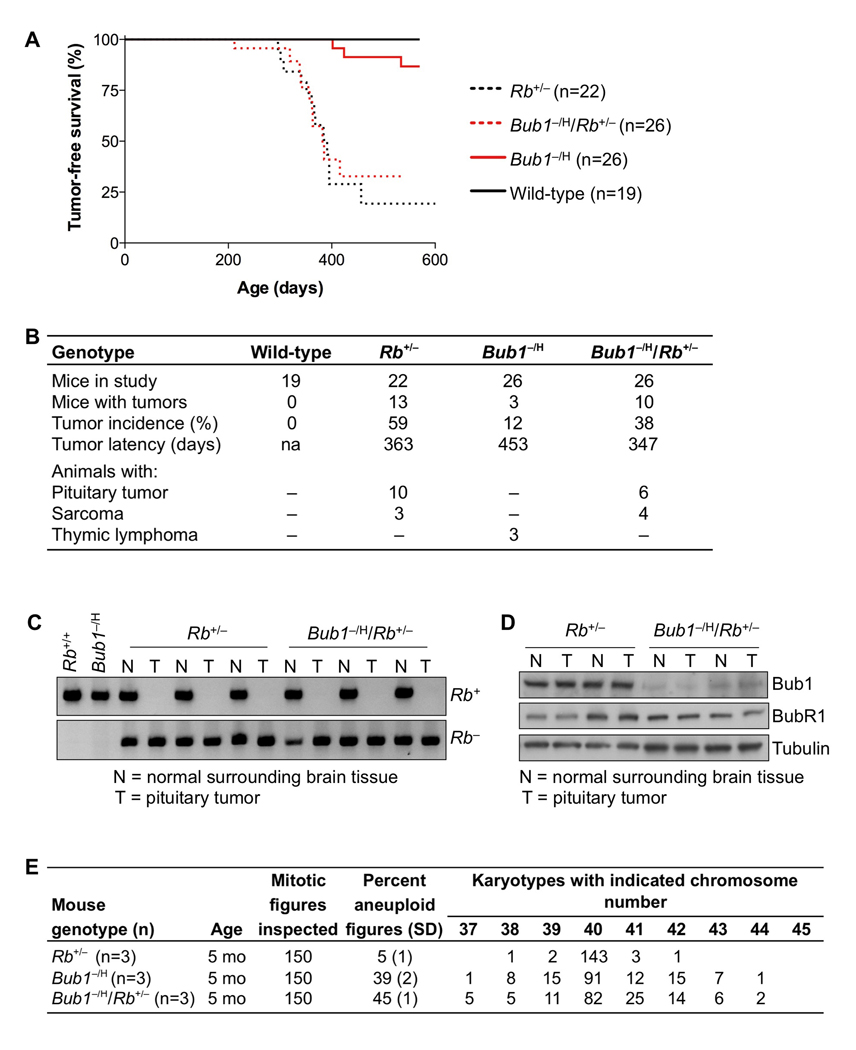
Figure 6. Tumorigenesis in Rb+/− mice is not impacted by Bub1 insufficiency.
(A) Kaplan-Meier tumor-free survival curves of Rb+/−, Bub1−/H/Rb+/−, Bub1−/H and wild-type mice. Curves of Rb+/− and Bub1−/H/Rb+/− mice are not significantly different from each other (Log rank test).
(B) Tumor spectrum of mice represented in (A). There were no statistically significant changes in tumor spectrum between any of the mouse cohorts (Fisher’s exact test).
(C) PCR-based screening for Rb LOH in pituitary tumors from Rb+/− and Bub1−/H/Rb+/− mice. As controls we used DNA samples from flanking normal brain tissue and brain DNA samples of wild-type and Bub1−/H mice.
(D) Western blot analysis of normal brain (N) and pituitary tumors (T) of Rb+/− and Bub1−/H/Rb+/− animals. Note that Bub1, but not the Bub1-related protein BubR1, was expressed at reduced levels in both normal and tumor tissues of Bub1−/H/Rb+/− mice. Tubulin was used as a loading control.
(E) Chromosome counts on splenocytes of 5-month-old Rb+/−, Bub1−/H/Rb+/− and Bub1−/H mice.

