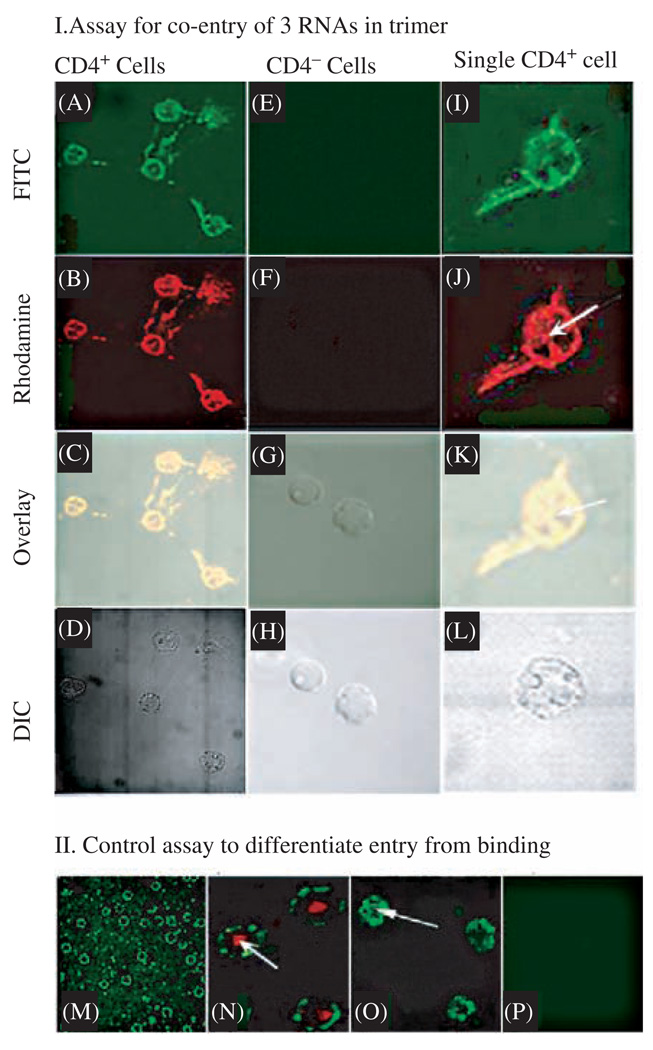
Fig. 9.
Confocal microscopy showing the specific and simultaneous delivery of three components to CD4 over-expressing cells. (I) Assay for the binding of pRNA trimer containing pRNA(A-b′)/aptamer(CD4), pRNA(B-e′)-FITC, and pRNA(E-a′)-Rhodamine to CD4 over-expressing T cells (A–D of left column, and I–L of right column) and CD4 negative cells T cells (E–H of middle column). A, E, and I were imaged with an FITC filter; whereas B, F, and J were viewed with a Rhodamine filter; C, G, and K are overlays; and D, H, and L are DIC images. The right column represents a close-up view of CD4 over-expressing cells. Arrows point to the complexes that had entered the cell. (II) Section of confocal microscopy images to differentiate between binding (M) and cell entry (arrows in N and O) as well as negative control (P). Binding of FITC-labeled pRNA trimer containing CD4-binding aptamer to lymphocytes was shown as a circle and entry was shown as a green spot inside cell (arrow in O). The red color in N is a positive entry control of transferrin labeled with Texas red. Reprinted with permission from [47], A. Khaled et al., Nano Lett. 5, 1797 (2005). © 2005, American Chemical Society.

