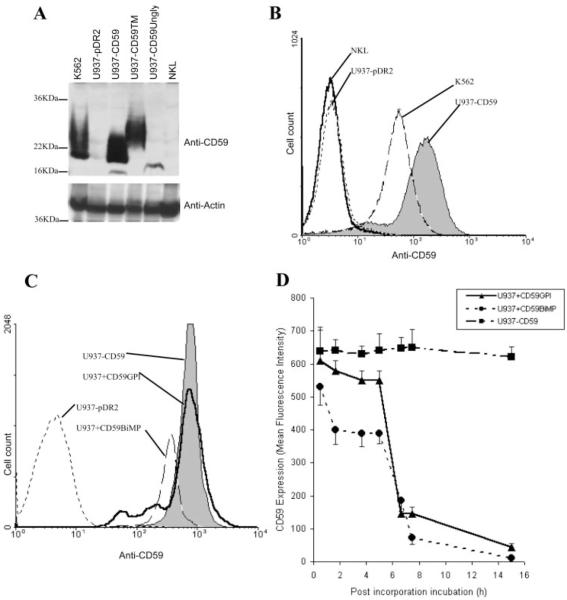
FIGURE 2.
Characterization of the cell line models. A, CD59 expression was determined by Western blotting demonstrating strong expression on K562 and on U937 transfected with the various forms of CD59, and no expression on vector-transfected U937 and the NKL cell line. B, Flow cytometry showed strong expression by U937 transfected with CD59 (U937−CD59) as compared with endogenous levels expressed by K562. The empty vector control (U937−pDR2) and the NKL effector cell line were negative. C, Incorporated proteins were also measured by flow cytometry, illustrating comparable levels between U937 transfected CD59, GPI-anchored CD59, and BiMP CD59 (U937−CD59, U937+CD59GPI, and U937+CD59BiMP). U937 transfected with the empty vector (U937−pDR2) is shown as control. D, Time course analysis of the incorporated proteins was determined by flow cytometry.

