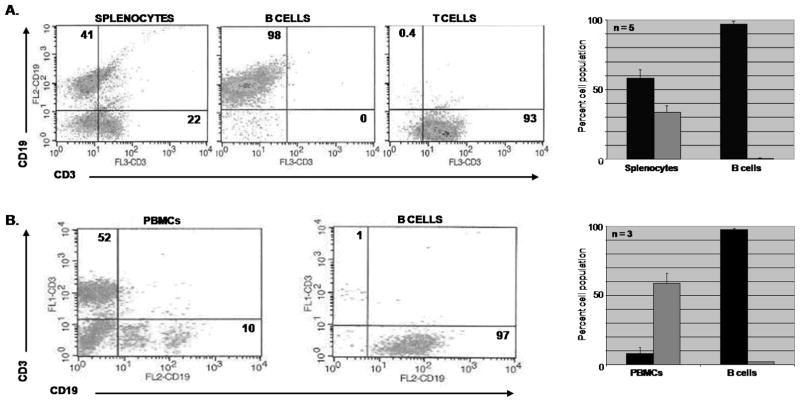
Figure 1. Phenotypic analysis by flow cytometry of lymphocyte subpopulations isolated from mouse splenocytes and human PBMCs.
A. Mouse B and T lymphocytes isolated from splenocytes by affinity purification (EasySep®) were treated with CD19-PE, CD3-PerCP, NK-pan-FITC and F/480-APC anti-mouse mAbs (FITC and APC data not shown) to confirm lymphocyte enrichment. Graph represents data of 5 independent B cell isolations. B. Human B cells isolated from PBMCs by affinity purification were analyzed with CD19-PE, CD3-FITC and CD14-APC anti-human mAbs (CD14 data not shown) to determine B lymphocyte enrichment. Graph represents data from 3 human donors. Black bars are B cells and grey bars are T cells.

