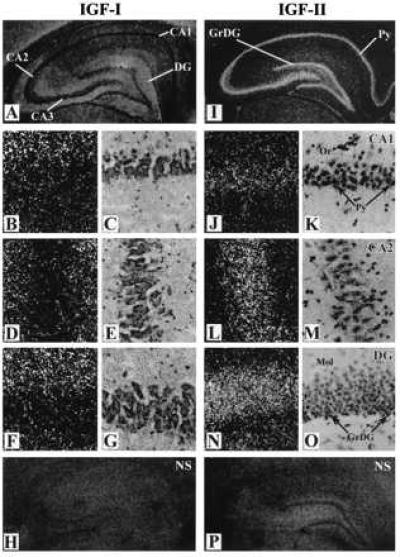
Figure 1.

Photomicrographs showing the cellular distributions of [125I]IGF-I (A–G) and [125I]IGF-II (I–O) receptor sites in the hippocampus (A, I) and in the CA1 (B, C, J, K), CA2 (D, E, L, M) and the DG (F, G, N, O) regions of the adult rat. H and P represent nonspecific labeling in the presence of excess unlabeled IGF-I and IGF-II, respectively. C, E, and G are the bright field representative of B, D, and F whereas K, M, and O are the bright field representative of J, L, and N, respectively. Or, stratum oriens; Mol, molecular layers of the DG; Py, pyramidal neurones; GrDG, granule cells.
