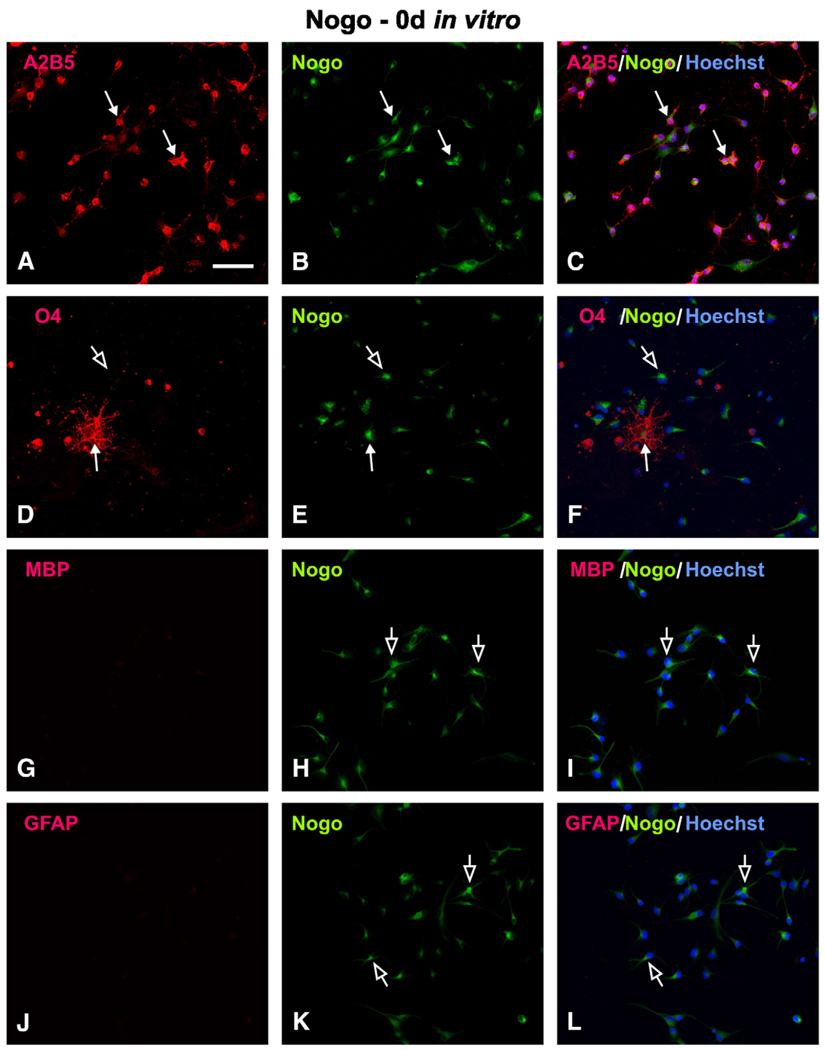
Fig. 1.
Cellular localization of Nogo-A in OPCs at 0 day in vitro. (A–C) Most Nogo-A-IR (B, solid arrow) cells co-expressed A2B5 (A, solid arrow), which can be appreciated in the merged image (C, solid arrow). (D–F) Nogo-A (E, solid arrow) was also localized in a few O4+ cells (D, solid arrow), as can be seen in the merged image (F, solid arrow). Note that most OPCs were Nogo-A+ and O4− (D–F, open arrow). The presence of Nogo-A+ but MBP− (G–I, open arrow) or GFAP− (J–L, open arrow) cells in these panels further confirms the specificity of Nogo-A expression at the OPC stage. Scale Bar: 50 µm.

