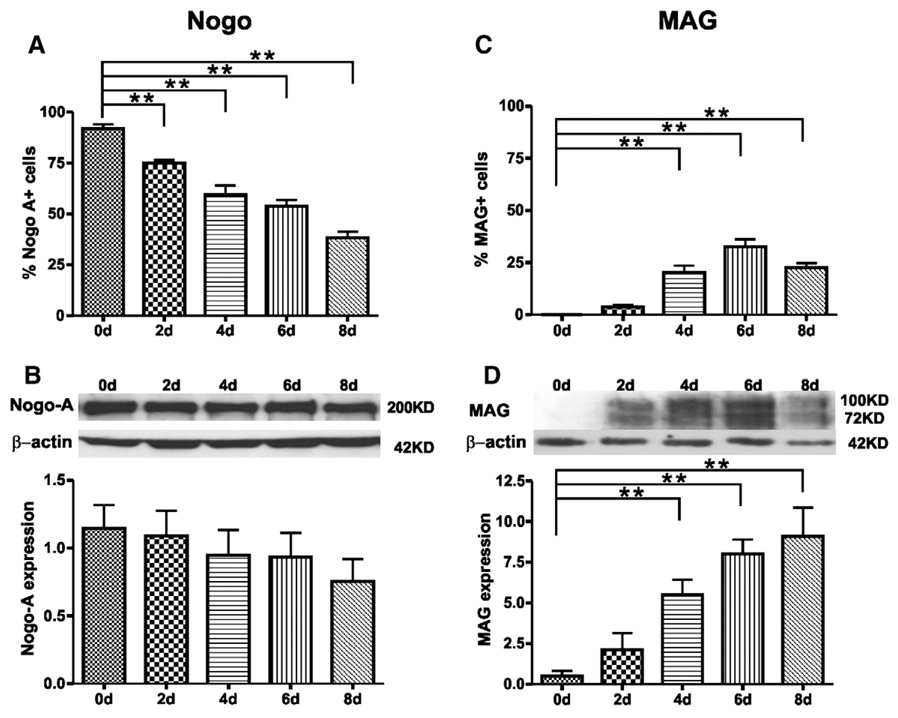
Fig. 6.
Quantification of Nogo-A and MAG expression during oligodendrocyte differentiation in vitro. (A, C) The percentage of cells that expressed either Nogo-A (A) or MAG (C) (n = 5 per time point; **, p<0.01 vs. 0 day). (B, D) Western blot analysis further confirmed the expression patterns of Nogo-A (B) and MAG (D). The top panel in B and D shows a representative time course of Nogo-A or MAG expression. The bottom panel in B and D shows compiled results in a bar graph for each time point (n = 5 per time point;**, p<0.01 vs. 0 day). Note that MAG expression was not detected at 0 day by either cell counts (C) orWestern blot analysis (D). Its expression, however, increased significantly at later time points (4, 6 and 8 days).

