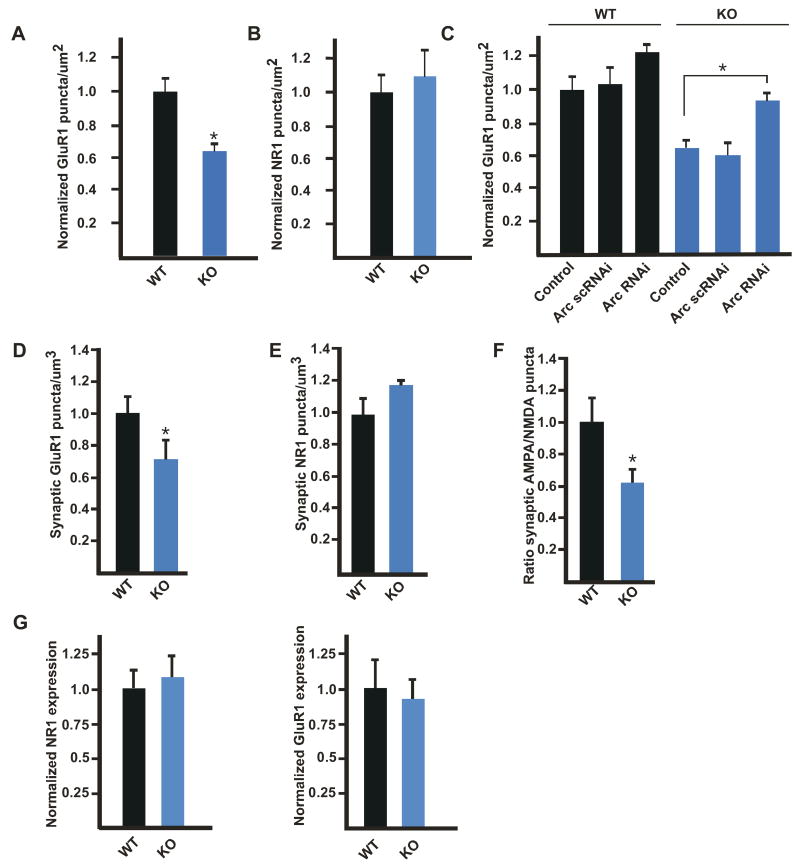
Fig. 6.
Ube3A knockout mice have fewer synaptically expressed AMPARs. (A) Quantification of plasma membrane expression of AMPARs on P2 + 12 DIV hippocampal neurons isolated from wild type (WT) and Ube3A knockout (KO) animals transfected at 8 DIV with GFP. At least 40 neurons were imaged for each condition, and data are normalized to wild type and presented as mean +/- SEM from three independent experiments. * indicates statistical significance P < 0.01, T-test. (B) Quantification of plasma membrane expression of NMDA receptors on P2 + 12 DIV hippocampal neurons isolated from wild type (WT) and Ube3A knockout (KO) animals transfected at 8 DIV with GFP. At least 24 neurons were imaged for each condition, and data are normalized to wild type and presented as mean +/- SEM from three independent experiments. (C) Quantification of plasma membrane expression of AMPA receptors on P2 + 12 DIV hippocampal neurons isolated from wild type (WT) and Ube3A knockout (KO) animals transfected at 8 DIV with GFP and either vector control, scrambled control shRNAs, or shRNAs targeting Arc. At least 28 neurons were imaged for each condition, and data are normalized to wild type transfected with control and presented as mean +/- SEM from three independent experiments. * indicates statistical significance P < 0.01, ANOVA, with Bonferroni correction for multiple comparisons. (D) Quantification of the number of co-localized GluR1 and SV2 puncta in wild type and Ube3A knockout hippocampi. Data are presented as mean +/- SEM from three independent animals for each genotype. * indicates statistical significance P < 0.01 T-test. (E) Quantification of the number of co-localized NR1 and SV2 puncta in wild type and Ube3A knockout hippocampi. Data are presented as mean +/- SEM from three independent animals for each genotype. P > 0.05, T-test. (F) Analysis of the ratio of the density of GluR1 puncta that co-localize with SV2 to the density of NR1 puncta that co-localize with SV2 obtained from (D) and (E). * indicates statistical significance P < 0.01 T-test. (G) Quantitative Western blot analysis of protein lysates prepared from the hippocampi of P21 wild type and Ube3A knockout mice using anti-NR1 (left panel) and anti-GluR1 (right panel) antibodies. Band intensity was normalized to the intensity of actin to control for differences in protein concentration. Data are presented as mean +/- SEM from three independent experiments. See also Figure S6.

