Abstract
Conventional studies of lightness constancy have almost exclusively used flat plain stimuli and have shown that lightness matches across illuminants cannot be explained by physical matches of reflectance or luminance. The perceptual qualities that underlie lightness judgments still remain largely unknown. Real objects are often 3-D and patterned, giving additional cues for identification. We examine the perceptual strategies that underlie material identification of real objects. Stimuli were randomly crumpled papers printed with achromatic patterns with precisely calibrated mean reflectance and reflectance contrast, placed in backgrounds under varying levels of illumination. Observers were asked to identify objects based on physical reflectance differences. Reflectance identification functions were simulated by simple models that perform object identification based on dissimilarities in perceived brightness (luminance dissimilarity modified by light adaptation) or perceived contrast (contrast dissimilarity modified by mean luminance). The reflectance identification results were also recreated in two control experiments, using identical stimuli conditions, where choices were based explicitly on dissimilarities in perceived brightness or contrast. Rather than a reverse optics model of lightness perception where observers first estimate illuminant intensity and then extract relative lightness by discounting the illuminant, this study supports the use of simple percepts such as brightness and contrast.
Keywords: lightness, brightness, constancy, natural stimuli, adaptation, material identification
Introduction
It is clear from black and white photographs that the lightness of surfaces conveys a great deal of information about the world. Vision is based on the image projected onto the retina, but the perception of lightness does not depend on a direct point-by-point representation of light intensity levels (Anderson, 1997; Chevreul, 1839; Todorovic, 1997; Zaidi, Spehar, & Shy, 1997). Instead, the visual system has to separate variations in illumination across space and/or time from variations in material reflectance (Adelson, 2000; Land & McCann, 1971; Sinha & Adelson, 1993). In the natural world, the light incident on the retina can vary by more than 10 orders of magnitude, whereas reflectance varies by less than 2 orders of magnitude. Some of the variation of intensity is attenuated by light adaptation (Craik, 1938; Zaidi, 2005), but this still leaves much to debate about the processes that lead to the inference of constant reflectances across illumination conditions (Adelson & Pentland, 1996; Arend & Goldstein, 1987; Arend & Reeves, 1986; Arend & Spehar, 1993a, 1993b; Fleming, Dror, & Adelson, 2003; Gilchrist et al., 1999; Gilchrist, 1988; Gilchrist & Annan, 2002; Kardos, 1934; Robilotto & Zaidi, 2004a; Wallach, 1963).
Conventional studies of lightness constancy use flat, plain gray papers placed on identical plain gray backgrounds under differing levels of illumination. Under this condition, reflectance ratios are approximately proportional to luminance ratios that, in turn, are independent of illumination level. If one paper were different in reflectance, observers could simply compare the luminance ratios between the papers and the background. Using simple luminance contrast values would allow observers to identify the paper with the odd ratio as the odd object. Under such conditions, lightness constancy has been shown to hold over wide ranges of illumination and reflectance (Gilchrist & Jacobsen, 1984; Wallach, 1948).
Next, imagine the above example, but with objects slanted with respect to the observer. For Lambertian surfaces, the luminance of the light reflected from the surface will depend on the cosine of the angle between the surface normal and the incident illumination. For non-Lambertain surfaces, for example, those with surface roughness, the luminance of the reflected light will also depend on the viewing angle. In order for observers to correctly extract reflectance ratios from luminance ratios between the tilted papers and background, it is necessary to properly estimate the angle of orientation of the papers relative to their illuminant. In this task, observers seem to differ considerably in the strategies they use and the degree to which they can discount the effect of slant (Bloj et al., 2004; Boyaci, Doerschner, & Maloney, 2004; Boyaci, Maloney, & Hersh, 2003; Doerschner, Boyaci, & Maloney, 2004; Ripamonti et al., 2004; Yang & Maloney, 2001).
The situation is more complicated if plain gray papers are used to make irregular 3-D objects. The uniform luminance across the surface is interrupted by surface orientation changes creating highlights and shadows. These orientation changes prevent taking luminance ratios between individual points on the objects and individual points on the background and equating those luminance ratios into reflectance ratios. If the backgrounds are variegated and contain many reflectance levels, the direct equation of luminance ratios to reflectance ratios is even more difficult. In this situation, Robilotto and Zaidi (2004a) showed that observers rely on perceived overall brightness of the objects to identify similar reflectances across illuminants. This strategy leads to very accurate identification in some conditions and systematic bias in others.
Studies of lightness perception have almost exclusively used plain, nonpatterned stimuli. Many objects in the world are patterned, and the question exists whether pattern contrast can aid in identifying materials across lighting conditions in the 3-D situation. There are reasons to expect that material identification should be better for patterned than for plain objects: (i) change in illuminant energy changes surface luminance but leaves surface pattern contrast relatively unchanged; (ii) in identifying a material, observers can use reflectance extremes or reflectance range to supplement mean reflectance; and (iii) memory for gray levels is poor even for very short intervals, whereas memory for contrast is substantially better (Sachtler & Zaidi, 1992).
It is useful to define distinctions between physical and perceptual properties in lightness perception. Reflectance (also referred to as lightness) is defined as the proportion of incident radiant flux reflected off of a point on a surface (Wyszecki & Stiles, 1982). When dealing with achromatic objects and illumination, reflectance is a one-dimensional variable. For patterned surfaces, we use mean reflectance to describe the reflectance averaged over all points on a surface. Reflectance contrast is defined as the Michelson contrast of a surface’s reflectance (Rmax - Rmin) / (Rmax + Rmin). Luminance is the intensity of light projected from a discrete area of a surface. It is dependent upon both a surface’s reflectance and illumination. Mean luminance will be used to describe the luminance averaged over all points on a surface. For real objects under real illuminants, luminance contrast (Lmax − Lmin) / (Lmax + Lmin) can be the same value as reflectance contrast, but it can also differ considerably due to the effects of light scatter.
All the terms defined above are physical quantities, measurable by light meters. There are also percepts that correspond to these physical quantities that cannot be measured with physical devices. Perceived brightness is a function of a surface’s mean luminance, adaptation based on luminance gain control (Craik, 1938; Helson, 1964; Robilotto & Zaidi, 2004a), and lateral interactions (Chevreul, 1839; Zaidi, 1999). Perceived contrast is a function of luminance contrast, mean luminance (Robilotto & Zaidi, 2004b), contrast adaptation (Georgeson, 1985), and contrast–contrast lateral interactions (Chubb, Sperling, & Solomon, 1989; De Bonet & Zaidi, 1997).
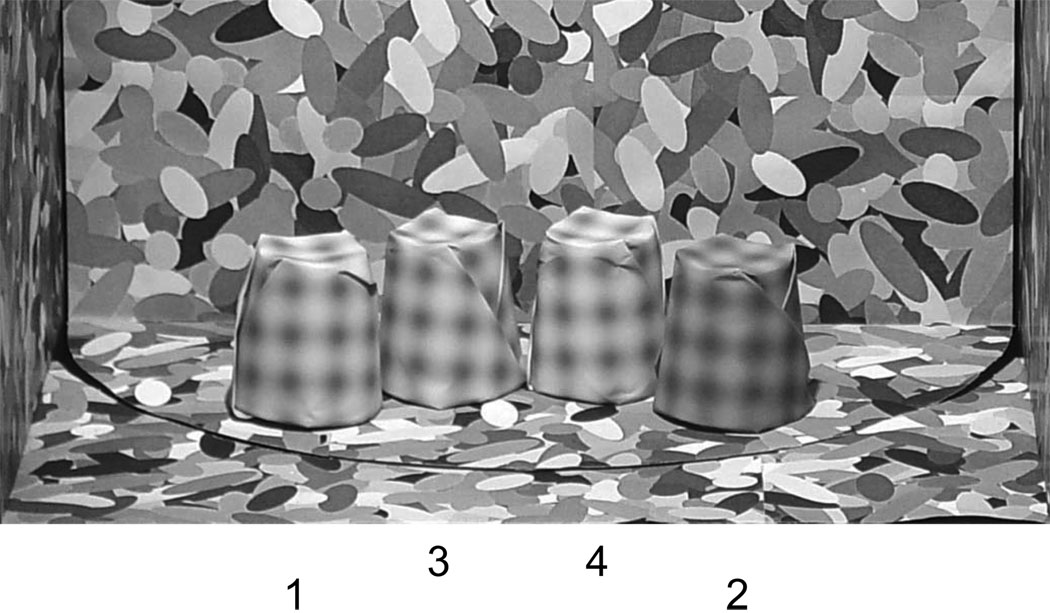
Consider the demonstration in Figure 1. The stimuli consist of crumpled papers printed with achromatic sinusoidal plaid patterns. The two compartments, each containing a pair of objects, are illuminated by separate light sources. In this example, the compartment on the left is receiving four times the illumination as the compartment on the right. Three of the objects are made from the same material and one from a different material. Which is the odd object? To perform this task correctly, you first choose the side that contains the pair of dissimilar objects. It is easy to tell that Objects 1 and 2 are different in mean reflectance. This only requires you to be able to discriminate perceived brightness within the same illuminant. Once the correct side has been determined, you have to identify which of those two objects are different from the pair under the other illuminant. For this second step, it is necessary to separate the intrinsic reflectance properties of the objects from the intensity of the illuminants, either visually or cognitively.
Figure 1.
Photograph of stimuli under experimental presentation. The two compartments each contain a pair of objects that are illuminated independently by light sources that differ in intensity by a factor of four. All four objects have the same reflectance contrast, but one differs in mean reflectance.
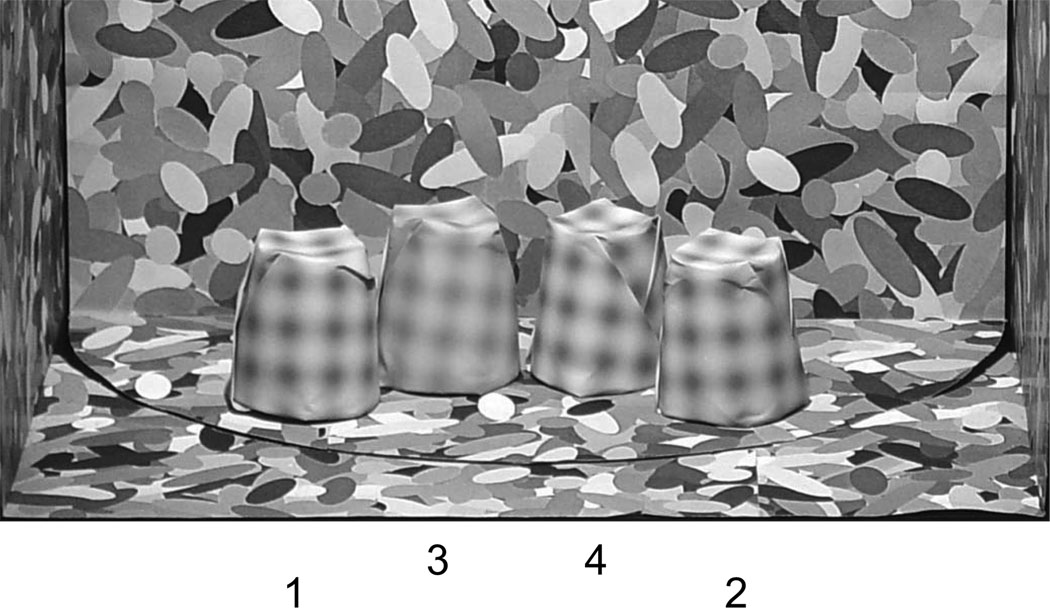
All four objects have the same reflectance contrast, but one has a different mean reflectance. Object 2 appears closer to Objects 3 and 4 in appearance, so Object 1 would be chosen as the odd object based on appearance dissimilarity. For comparison under a single illuminant, Figure 2 shows Objects 3 and 4 moved to the other compartment behind Objects 1 and 2. It is clear from Figure 2 that Object 2, in fact, has a lower mean reflectance than the other three. We are interested in identifying the percept that underlies both correct and incorrect identification in such situations.
Figure 2.
Photograph of stimuli for comparison purposes. The two objects from the right compartment in Figure 1 have been moved to the left compartment behind Objects 1 and 2. When all four objects are under a single illuminant, it is clear that Object 2 is different in mean reflectance.
Robilotto and Zaidi (2004a) used a similar method for quantifying material identification for plain gray papers with uniform reflectance. For a given reflectance condition, we compared the ratio of responses in which the correct object was chosen to the responses in which the correct compartment was chosen. This relationship was used to quantify material identification performance across illuminants and compare it to discrimination within illuminants (Khang & Zaidi, 2002). In a second experiment, we gave observers an explicit strategy to follow and found that observers could rely on perceived relative brightness to achieve the measured proportions of correct material identification. We also showed that a model in which perceived brightness is a function of object reflectance plus adaptation to the mean luminance of the local environment could simulate the identification results. One of the questions we now ask is whether material identification is aided by the addition of surface pattern, and whether that changes the identification strategy.
Whereas lightness constancy has generally been measured for objects of uniform reflectance, contrast constancy has been treated as a different issue in the spatial frequency literature without reference to object perception. Contrast constancy has been shown to depend significantly on the mode of presentation. With long periods of adaptation, dichoptically tested identification is accurate across large changes in mean luminance (Georgeson & Sullivan, 1975; Kulikowski, 1976). Under more natural viewing conditions, contrast identification is accurate over a more limited range of approximately 1 log unit of luminance (Peli, Yang, Goldstein, & Reeves, 1991). Beyond this range, patterns with lower mean luminances have lower perceived contrasts than patterns with identical reflectance contrasts but higher mean luminances (Peli, 1995; Peli, Arend, & Labianca, 1996). Most studies of contrast constancy use sine wave patterns for which Michelson contrast is a decent approximation of perceived contrast. Robilotto and Zaidi (2004b) measured contrast matches for variegated stimuli. For these stimuli, perceived contrast increased with mean reflectance. All of the above studies used CRT displays. With real objects and lights, increasing the incident light to increase the mean luminance also increases the light scattered from the surface, and this can decrease the luminance contrast depending on the roughness of the surface (Nayar & Oren, 1995).
Figure 3 presents a situation similar to Figure 1. Three of the objects are made from the same paper and one from a different paper. Which is the odd object? To correctly perform this task, you can use the same procedure as in Figure 1 by first choosing the side that contains the pair of dissimilar objects, then identifying across illuminants which of those two is different in material from the other pair.
Figure 3.
Photograph of stimuli under experimental presentation. The two compartments each contain a pair of objects that are illuminated independently by light sources that differ in intensity by a factor of four. All four objects have the same mean reflectance, but one differs in reflectance contrast.
It is easy to see that Objects 3 and 4 are dissimilar in reflectance contrast, but neither is matched in appearance to Objects 1 and 2. In this example, all four objects have the same mean reflectance, but one has a different reflectance contrast. For comparison under a single illuminant, Figure 4 shows Objects 3 and 4 moved to the other compartment behind Objects 1 and 2. It is clear from this presentation that Object 3 has a lower reflectance contrast than the other three. We are interested in identifying the percept that underlies both correct and incorrect identification in such situations.
Figure 4.
Photograph of stimuli for comparison purposes. The two objects from the right compartment in Figure 3 have been moved to the left compartment behind Objects 1 and 2. When all four objects are under a single illuminant, it is clear that Object 3 is different in reflectance contrast.
Most studies of lightness perception use asymmetrical lightness matching and have concentrated on whether observers’ lightness matches are closer to reflectance or luminance (Bruno, 1994; Ripamonti et al., 2004; Schirillo & Arend, 1995; Thouless, 1931; Woodworth, 1938). This is quantified by constancy indices that give values between 0.0 and 1.0, corresponding to the two alternatives. All of these studies have resulted in matches that were neither exactly reflectance nor luminance. Because observers are matching some percept, the question remains what is the percept? In identifying surface qualities across illuminants, we will test the roles played by the percepts of brightness and contrast.
Methods
Stimuli
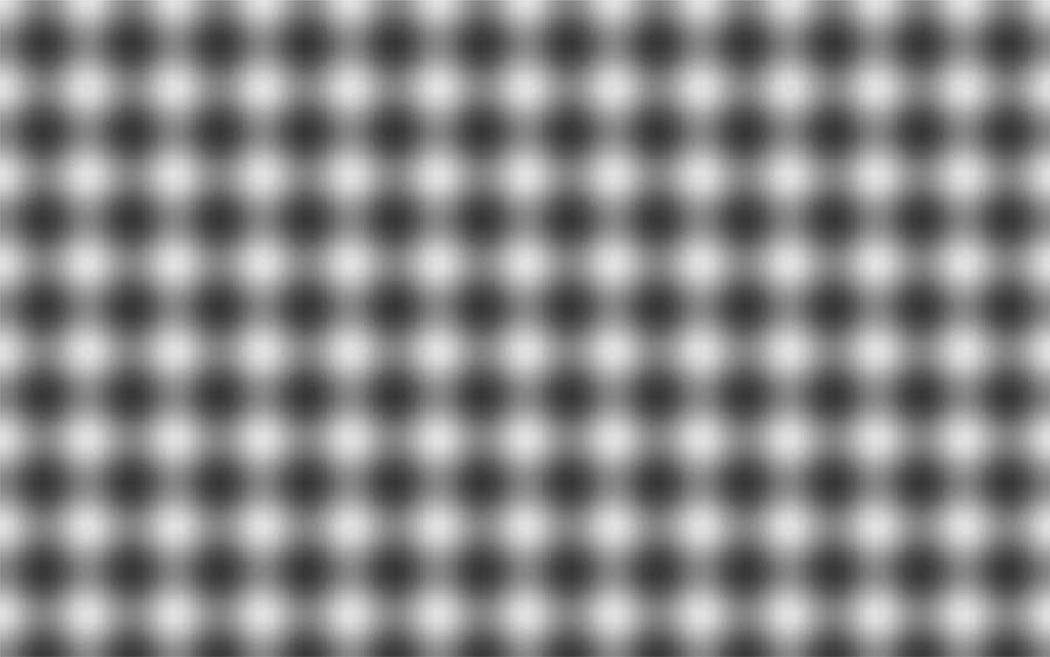
Achromatic plaid patterns were printed on pieces of paper and crumpled around small cups that measured 6 cm high and 6 cm wide at their base. The plaid patterns were computer generated by summing two identical sinusoidal gratings with orthogonal orientations. Each pattern was saved as 300 dpi TIFF image (Figure 5). Images were printed on Epson Photo Quality Ink Jet matte paper with an Epson Stylus Photo 1280 ink jet printer (Epson America Inc., Long Beach, CA). At the observer’s viewing distance of 195 cm, the patterns had a spatial frequency of 2 cycles per degree.
Figure 5.
Achromatic, plaid surface pattern of the stimuli. Plaids were computer generated by summing orthogonal sinusoidal gratings with equal spatial frequency. Patterns were varied by adjusting the plaid’s mean reflectance or reflectance contrast.
A Piezography Continuous Ink System with PiezoTone Warm-Neutral/Museum Black inks (InkJet Mall, Bradford, VT) was used to increase the printer’s grayscale resolution and output range. The Piezography system replaced the printer’s standard color inks with four different dilutions of black pure-pigment ink.
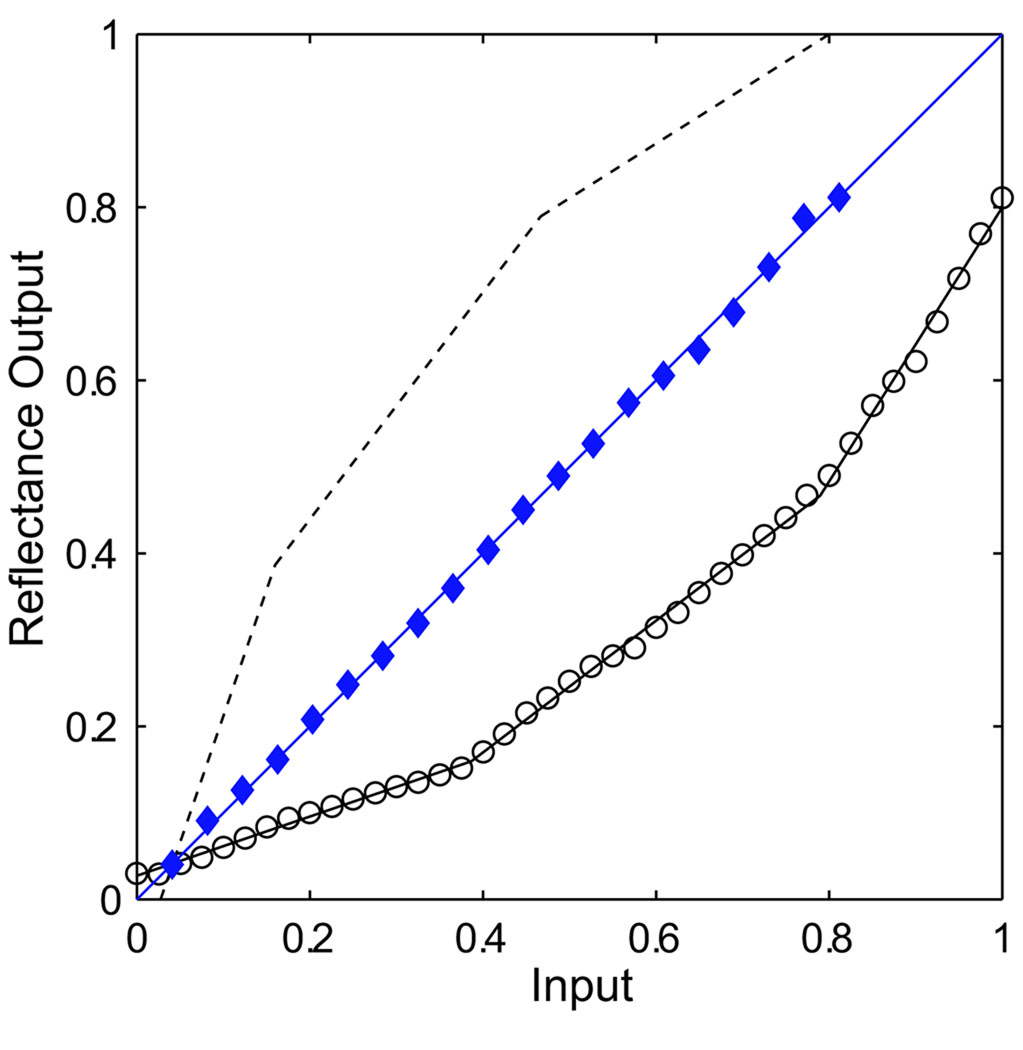
To linearize the printer’s reflectance output, 21 solid gray test patches were printed with inputs of 0–100% white in 5% increments (Figure 6). The luminances of the patches were measured (open circles) and fit with three independent linear segments. The fit functions were inverted (dashed lines) and used to transform the input values for a second set of test patches. The corrected set was measured (filled diamonds) and fell along the unit diagonal, confirming linearity. These input conversion functions were then incorporated into the pattern-generating software.
Figure 6.
Input–output functions of the quad-tone printing system. The uncorrected reflectance outputs (circles) were fit and inverted (dashed line) to generate a linear reflectance output (diamonds).
To calibrate the reflectances of the stimuli, a Color Aid reference patch with 90% reflectance (Color Aid, New York, NY) was placed in one of the experimental viewing compartments under full illumination. A Spectra Scan 650 photometer (Photo Research Inc., Chatsworth, CA) was placed at the observer viewing position and the luminance of the patch, measured at 336 cd/m2, was used to convert all successive luminance measurements into percent reflectances.
Eight sets of stimuli were used. Each set included three standard objects identical in mean reflectance and reflectance contrast, plus 12 test objects that differed in one of the two reflectance parameters (Table 1). Four of the sets contained test objects with the same reflectance contrast as their standards and varied in mean reflectance. The other four sets contained test objects with the same mean reflectance as their standard and varied in reflectance contrast.
Table 1.
Reflectance properties of the eight sets of stimuli.
| Set contrast | Test mean, (–) Δ | Standard mean | Test mean, (+) Δ | ||||||||||
|---|---|---|---|---|---|---|---|---|---|---|---|---|---|
| 0.0 | 0.080 | 0.095 | 0.110 | 0.125 | 0.140 | 0.155 | 0.170 | 0.198 | 0.226 | 0.254 | 0.282 | 0.310 | 0.338 |
| 0.0 | 0.172 | 0.200 | 0.228 | 0.256 | 0.284 | 0.312 | 0.340 | 0.374 | 0.408 | 0.442 | 0.476 | 0.510 | 0.544 |
| 0.46 | 0.080 | 0.095 | 0.110 | 0.125 | 0.140 | 0.155 | 0.170 | 0.198 | 0.226 | 0.254 | 0.282 | 0.310 | 0.338 |
| 0.46 | 0.172 | 0.200 | 0.228 | 0.256 | 0.284 | 0.312 | 0.340 | 0.374 | 0.408 | 0.442 | 0.476 | 0.510 | 0.544 |
| Set mean | Test contrast, (–) Δ | Standard contrast | Test contrast, (+) Δ | ||||||||||
|---|---|---|---|---|---|---|---|---|---|---|---|---|---|
| 0.17 | 0.050 | 0.080 | 0.110 | 0.140 | 0.170 | 0.200 | 0.230 | 0.260 | 0.290 | 0.320 | 0.350 | 0.380 | 0.410 |
| 0.17 | 0.280 | 0.310 | 0.340 | 0.370 | 0.400 | 0.430 | 0.460 | 0.490 | 0.520 | 0.550 | 0.580 | 0.610 | 0.640 |
| 0.34 | 0.050 | 0.080 | 0.110 | 0.140 | 0.170 | 0.200 | 0.230 | 0.260 | 0.290 | 0.320 | 0.350 | 0.380 | 0.410 |
| 0.37 | 0.280 | 0.310 | 0.340 | 0.370 | 0.400 | 0.430 | 0.460 | 0.490 | 0.520 | 0.550 | 0.580 | 0.610 | 0.640 |
Apparatus
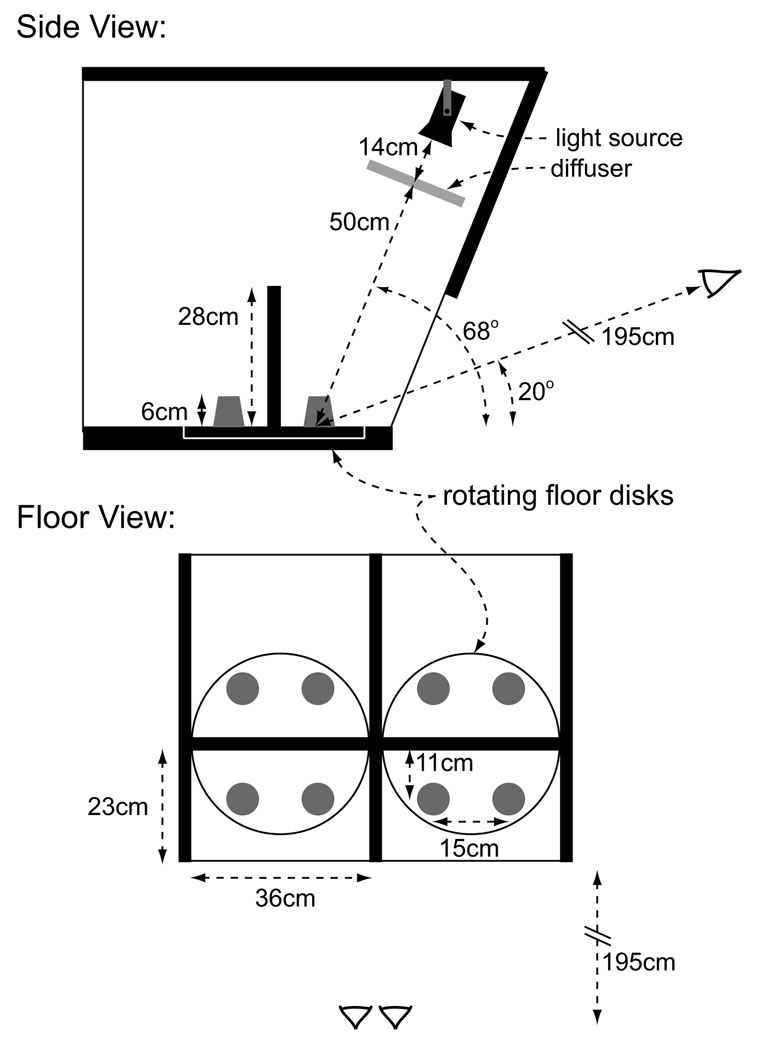
Stimuli were presented in a large wooden box separated by a central partition to form two side-by-side compartments (Figure 7). Each compartment measured 36 cm wide, 23 cm deep, and 70 cm high, with the lower front 28 cm open, allowing observers to see inside. The entire box was painted with matte black spray-paint (Krylon ultra-flat #1620, Cleveland, OH). The interior portions viewable to the observers were covered in paper consisting of overlapping gray-scale ellipses of random size and orientation, ranging in reflectance from 0.09 to 0.90 with a mean of 0.26.
Figure 7.
Schematic diagram of the viewing apparatus showing dimensions of the compartments, stimuli, light source, and viewing position. The setup is shown from both a side view inside a single compartment, and from a top view showing both compartments.
Each compartment was illuminated from above by a separate 50-Watt SoLux light bulb with a color temperature of 4700K and a beamspread of 36 deg (Tailored Lighting, Rochester, NY). The lamps were not visible to the observers. One of the lamps had a 25% transmission neutral density filter (Rosco Cinegel N.6, Stamford, CT) placed directly in front of it, reducing the illumination in that compartment to one quarter of the other compartment’s illumination. The side containing the filter was randomly chosen before each session and the filter was replaced regularly to prevent heat damage. To ensure uniform illuminant intensity throughout the compartments, polycarbonate holographic diffusers with 30 deg diffusion angles (Physical Optics Corporation, Torrance, CA) were placed 14 cm in front of the lamps. Each diffuser was 50 cm from the center of the compartment floor, with the central incident beam having an angle of elevation of 68 deg.
The back walls of each compartment were mounted on rotating disks embedded in the floors. On either side of the back walls, pairs of pegs were mounted on the floor disks 11 cm from the back wall and 15 cm from each other. Stimuli were placed over the pegs for presentation. While an observer viewed a given condition, the experimenter would place the next set on the pegs behind the back wall through the open back of the box. Once the observer signaled a response, the floors and back walls were rotated 180 deg and the new set of stimuli were presented.
Procedure
For each condition, observers were presented with four objects, two in each compartment. Three of the objects were identical standards, whereas the fourth test object differed in either mean reflectance or reflectance contrast. Viewing was binocular at a distance of 195 cm with an angle of elevation of 20 deg, and observers could look freely between the two compartments. The illumination differed between the compartments by a factor of 4. Except for the two light sources, the room was dark. The two observers were graduate students with corrected visual acuities of 20/20. Both observers were run in all three experiments.
The only difference in procedure between the three experiments was in the instructions. In Experiment 1, observers were instructed to identify the object that was physically different from the other three. The following instructions were given to each observer: “In each trial you will be presented with four objects; two in each compartment. Three of the objects are made from the same paper and are identical in shade and pattern. The fourth object is made of a different paper. Your task is to identify the one object made from the different paper than the other three. Notice that the two compartments are receiving different amounts of illumination. In doing this task, it is helpful to first decide which compartment contains two objects different from each other, and then decide which of those two is different from the two in the other compartment.”
After reading the instructions, a few practice trials were run. First, all four objects were placed in the same compartment as in Figure 2. The observers watched as the experimenter moved two of them into the other compartment, as in Figure 1, and their change in appearance was noted. Once it was established that the observers understood the task, the sessions began. On the back wall above each object, there was a number (1, 2, 3, or 4) that observers used to indicate their response, which was then manually recorded by the experimenter. After the preexperimental sessions, no feedback was given regarding observer accuracy and observers had as long as they wanted to respond.
Data from Experiment 1 were collected over the course of 16 sessions per observer, each lasting approximately 45 min. In each session, two sets of trials were randomly intermixed, one with test objects varying in mean reflectance and the other with test objects varying with reflectance contrast. During a single session, two sets of standards were used. For both sets, each of the 12 test objects was presented four times under both full and reduced illumination during each session, resulting in 192 presentations per session. Each of the eight standard/test sets was used for four sessions, resulting in 16 presentations of every test object under both illumination conditions. The order of the sets used and the compartments containing the filter were randomly selected for each observer before sessions began. In a single session, each test was presented an equal number of times in each position, with a randomized sequence.
In Experiment 2, observers were instructed to choose the one object most different from the other three in overall brightness. The following instructions were used: “In the following experiment you will again be presented with four objects; two in each compartment. Your task is to choose the object that appears most different in overall brightness.” Observers were told that more than one object may appear different in brightness, and that they were to choose the one most different from the others. They were also told that unlike Experiment 1, Experiment 2 had no correct answers because they were asked to make judgments based on perceived appearance. Again, before the sessions began, a few practice trials were run to ensure that observers clearly understood the task. Data from Experiment 2 were collected over the course of eight sessions per observer, and only the four sets with varying mean reflectance were used.
In Experiment 3, observers were instructed to choose the one object different in contrast. The following instructions were used: “In the following experiment you will again be presented with four objects; two in each compartment. Your task is to choose the object that appears most different in contrast.” Again, before the sessions began, a few practice trials were run to ensure observers clearly understood the task. Data from Experiment 3 were collected over the course of eight sessions per observer, and only the four sets with varying reflectance contrast were used.
Results
Experiment 1—Material identification
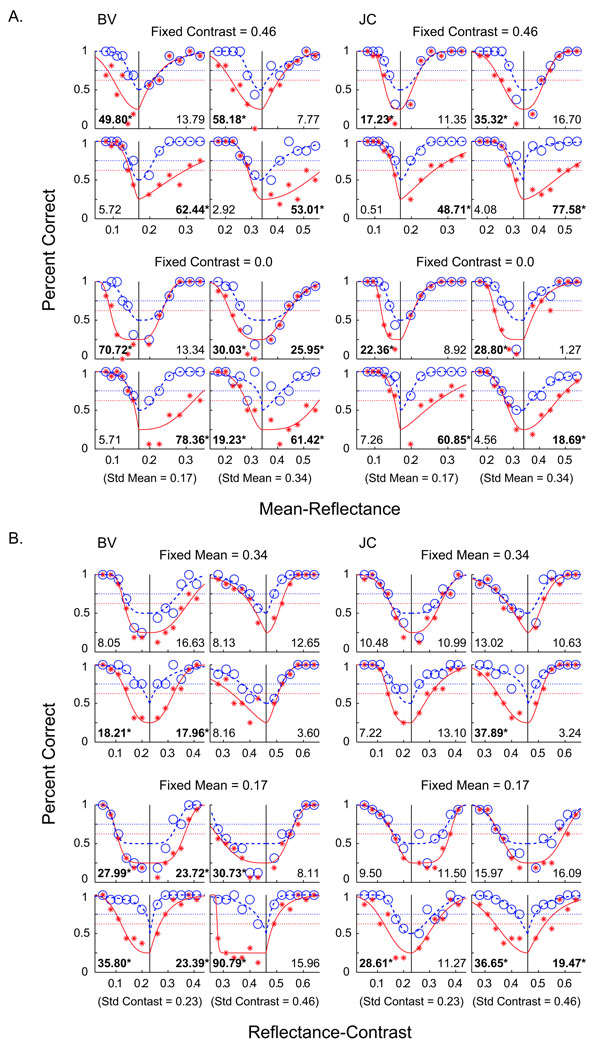
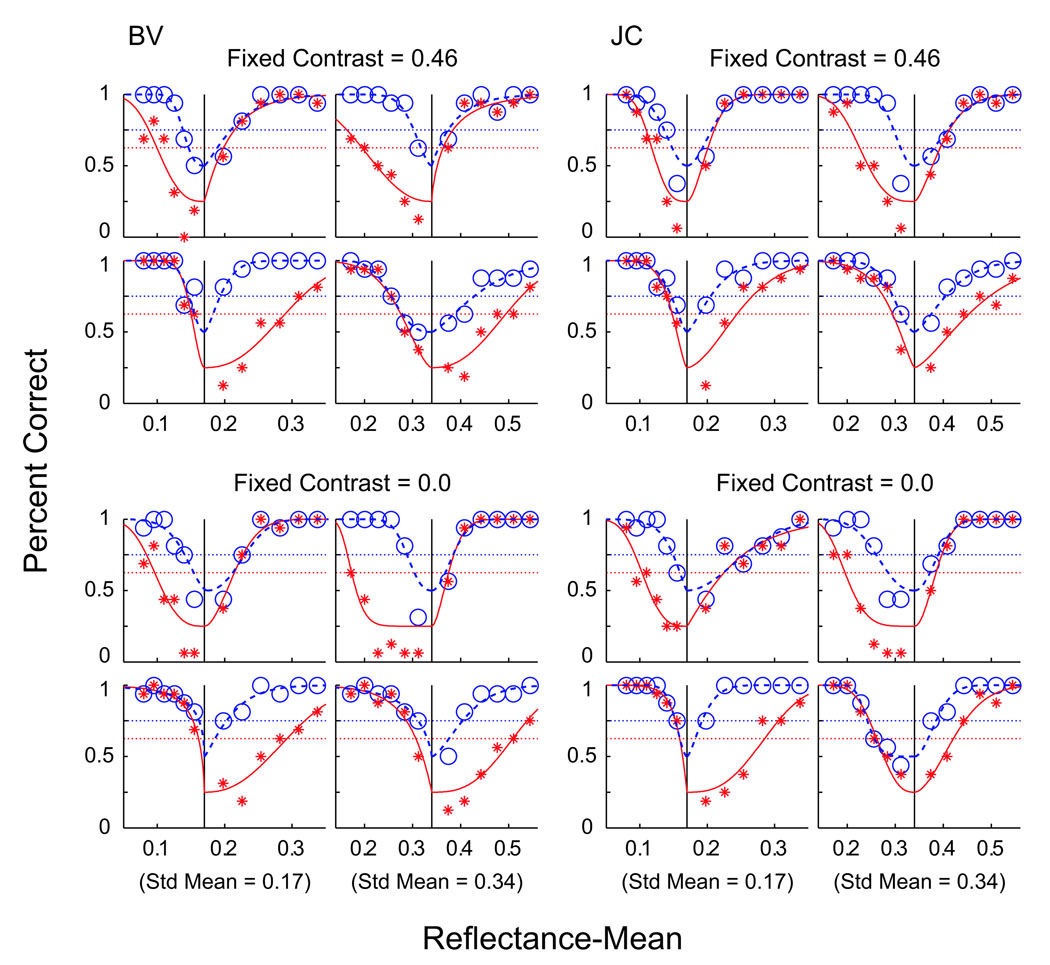
Experiment 1 required observers to identify the object different in lightness from the other three. Results for two observers, BV and JC, are plotted in Figure 8 in terms of percent correct. BV’s data are plotted in the left half of the figure, whereas JC’s data are plotted in the right. Figure 8A shows conditions from Experiment 1a in which test objects have the same reflectance contrast as their standards and varied only in mean reflectance. Figure 8B shows conditions from Experiment 1b in which test objects have the same mean reflectance and varied only in reflectance contrast. Note that these two types of conditions were randomly interleaved during each session, and the observers’ task was the same, that is, identifying the odd object.
Figure 8.
Results from Experiment 1. Proportion of correct response versus (A) mean reflectance or (B) reflectance contrast of test objects.
Experiment 1a used four sets of stimuli. Two sets each had a reflectance contrast fixed at either 0.46 or 0.0. These are represented by the two groups of four subplots for each observer. The two sets fixed with 0.0 reflectance contrast had no reflectance pattern and appeared solid gray. Within each group of four subplots, the left and right pairs represent conditions in which the sets’ standard objects had mean reflectances of 0.17 and 0.34, respectively (indicated by the vertical lines).
Experiment 1b also used four sets of stimuli. Two sets each had a mean reflectance fixed at either 0.34 or 0.17. These are represented by the two groups of four subplots for each observer. Within each group of four subplots, the left and right pair represent conditions in which the sets’ standard objects had a reflectance contrast of 0.23 or 0.46, respectively (indicated by the vertical lines).
Throughout Figure 8, for each vertical pair of subplots, the upper subplot indicates conditions in which the test object was presented in the compartment under full illumination, whereas the lower subplot indicates conditions in which the test object was presented in the compartment under reduced illumination.
Within each individual subplot, 12 test levels (6 on either side of the standard) are presented. For any given test level, red stars represent proportion of responses in which the test object was correctly identified (out of 16 presentations). Open blue circles represent proportion of responses in which either object in the compartment containing the test was chosen (i.e., the correct object or the incorrect object on the correct object’s side). In this way, the four alternative force choice paradigm can be analyzed like a standard 2 × 2 detection discrimination procedure (MacMillan & Creelman, 1991). First, observers choose the pair of objects that have a larger perceived difference under the same illuminant and thus choose the side that contains the test object. Observers then identify which of the two objects on that side are different in the relevant quality from the two objects under the other illumination. In other words, observers first discriminate within illuminants, then identify across illuminants. The proportion of side-correct as a function of test reflectance provides the discrimination threshold, whereas the proportion of object correct as a function of test reflectance provides the material identification threshold.
Data sets on either side of the standards were independently fit with psychometric functions by means of maximum likelihood ratios (for details, see Robilotto & Zaidi, 2004a). The side-correct function (blue curve) measures an observer’s ability to discriminate a material’s brightness differences within an illuminant. This brightness discrimination function has a chance level of 0.5 and a threshold level set at 0.75. The object-correct function (red curve) measures an observer’s ability to identify a material’s reflectance properties across dissimilar illuminants. This material identification function has a chance level of 0.25 and a threshold level set at 0.625. Threshold levels are indicated by the blue and red dashed lines.
The two observers have similar detection and identification psychometric curves. In all cases, side-correct functions reach levels at or near 100% within the reflectance ranges used. Object-correct functions show more variability than side-correct functions, but all approach or exceed threshold level within the given reflectance ranges. Object-correct variability includes less consistent shapes of the fit functions and more scatter among individual points. The variability can be accounted for by the fact that only when the correct side has been correctly chosen does the correct object have a chance of being chosen. This is equivalent to reducing the number of object-correct identification trials for conditions where the test reflectance is near or below side-correct threshold.
Material identification for varying mean reflectance
In Experiment 1a, material identification functions (based on object-correct proportions) display a systematic asymmetry across conditions (Figure 8A). This is seen within individual subplots by comparing the six test objects on the lower reflectance side of their standard to the corresponding six test objects on the higher reflectance side of the same standard. Identification functions have decreased proportions of object-correct responses with lower reflectance test sets under full illumination and with higher reflectance test sets under lower illumination. For these conditions, material identification curves require a greater reflectance difference to reach threshold.
If observers were to perfectly account for illuminant changes when identifying materials across the different environments, their ability to identify the correct object would be limited solely by their ability to discriminate within each compartment. Threshold levels for discrimination and material identification functions would therefore be at the same reflectance. We tested this hypothesis by analyzing the distribution of incorrect responses for each set of six test objects on both reflectance sides of each standard. Under this hypothesis, the incorrect object identification responses should be randomly distributed among the three standard objects. In other words, if identification errors are made only when observers cannot discriminate between the objects, observers will choose at random, and the incorrect responses will be evenly distributed among the three wrong answers. The number of [incorrect-side] responses should then be twice that of [incorrect-object given correct-side] responses. If this hypothesis is incorrect, a larger portion of responses will result in [correct-side but incorrect-object] responses (for a fuller derivation, see Robilotto & Zaidi, 2004a). Maximum likelihood estimates were calculated based on this hypothesis and then compared to the observed data with a chi-square test. With the given parameters and 6 degrees of freedom (one for each test reflectance level), the critical value of χ2 at the 0.01 significance level is 16.81. Each χ2 value from Experiment 1 is shown in Figure 8A under the data set from which it was obtained. Values greater than the critical value are in bold and labeled with asterisks, signifying conditions where the hypothesis that identification is limited only by discrimination can be rejected. The pattern of χ2 values from Experiment 1a is systematic and similar for the two observers. In the variable mean reflectance conditions, when the test objects under full illumination have lower mean reflectances than the standards, and when test objects under reduced illumination have higher mean reflectances than the standards, the above hypothesis is always rejected (16/16 times combined for both observers). The hypothesis generally fails to be rejected in conditions when test objects under full illumination have higher mean reflectances than the standards, and when test objects under reduced illumination have lower mean reflectances than the standards (rejected 2/16 times combined for both observers). These asymmetries are similar to those found for plain gray papers (Robilotto & Zaidi, 2004a).
One problem with this statistical method is that if there is a bias in choosing the side containing the test, the distribution of errors could be affected. For example, if the difference between standard and test is less than or close to the mean reflectance threshold, observers could systematically choose the darker side when they cannot discriminate brightness differences. This seems to be happening in Experiment 1a and can be seen in the side-correct functions when comparing conditions in which the test objects were on the side of full illumination versus reduced illumination (i.e., upper versus lower subplot). Conditions of reduced illumination generally have higher relative proportions of correct-side responses, especially when the difference between test and standard is low. This results in steeper functions and lower reflectance thresholds for the reduced illumination conditions.
As an example of the illumination-based side-correct bias, look at the pair of plots for BV for the standards with a fixed contrast of 0.0 and fixed mean of 0.34. Here, the side-correct response rates under full illumination start off well below chance, whereas side-correct response rates for the reduced illumination condition begin near threshold levels even for the lowest test differences. Due to this bias, in this pair of subplots, the chi-square tests are rejected in all four conditions.
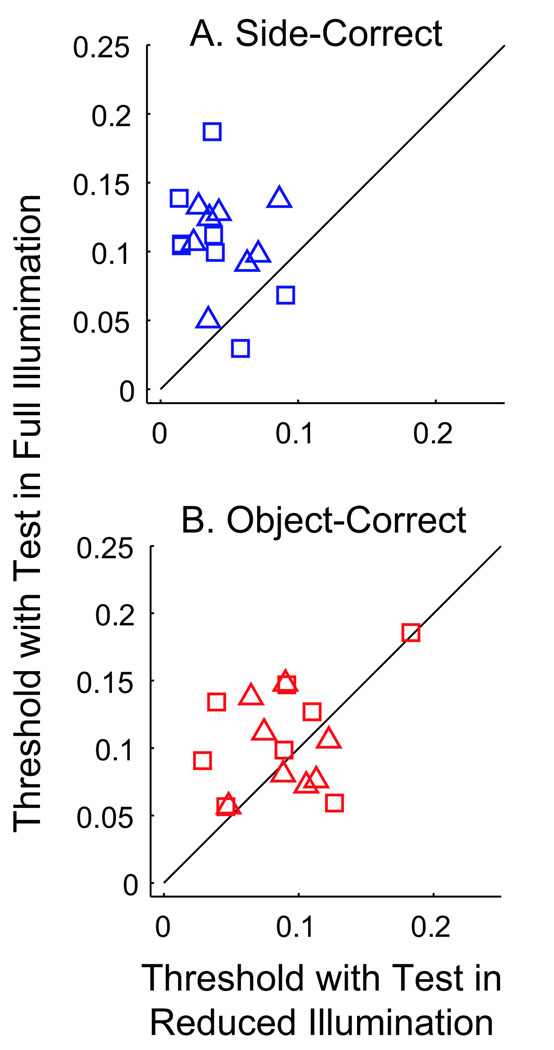
The overall trend across both observers in Experiment 1a can be seen in Figure 9A. Here, mean reflectance levels that give side-correct thresholds are plotted for conditions of full illumination versus reduced illumination. In the plots, data points from BV are represented by squares and JC by triangles. Test objects under reduced illumination resulted in lower thresholds for 12 of 16 conditions. These thresholds are in reflectance units and would be expected to be independent of illumination level by Weber’s law. When reflectance differences between standard and test are low, observers are more likely to report object materials as different when they are under the lower illumination.
Figure 9.
(A) Detection and (B) identification thresholds of Experiment 1a for conditions of “test objects in full illumination” versus “test objects in reduced illumination”. Squares and triangles represent observers BV and LC, respectively.
The discrimination bias does not lead to a simple asymmetry in the identification thresholds (Figure 9B). Instead, results are grouped in two separate distributions on either side of the unit diagonal with half of the points for each observer in each group. To ascertain that the comparisons between the shapes of discrimination and identification curves are not misleading, we present another way to quantify the asymmetries in the material identification curves.
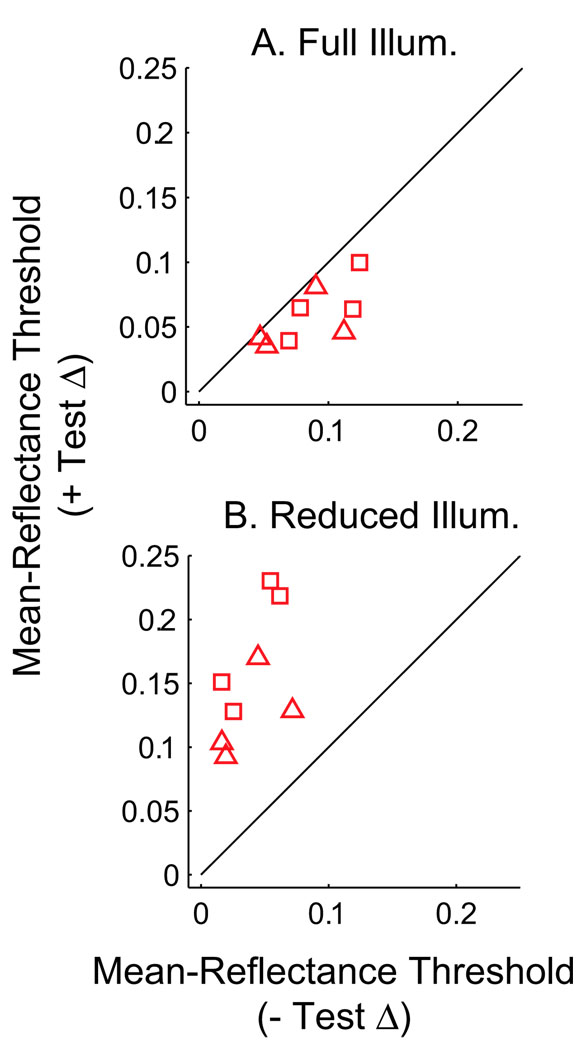
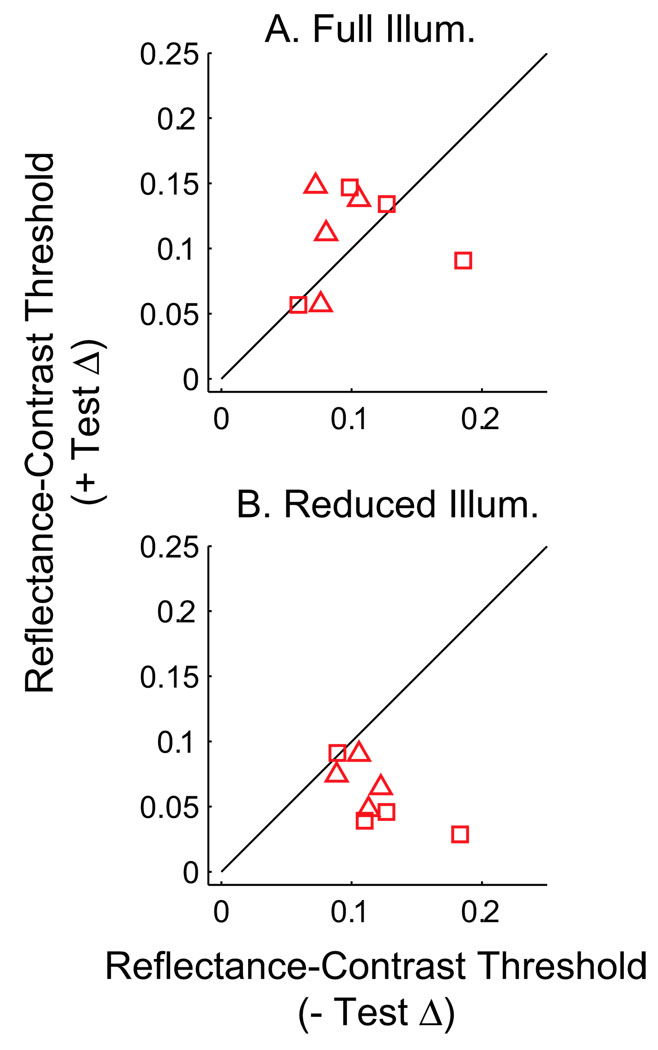
Another way to examine the asymmetries of material identification curves across illuminants is to compare mean reflectance thresholds for +Δ tests (higher mean than the standard) versus −Δ tests (lower mean than the standard). This is done for conditions in which the tests are under full illumination (Figure 10A) and conditions in which the tests are under reduced illumination (Figure 10B). In the plots, data points from BV are represented by squares and JC by triangles. Mean reflectance thresholds when test objects are under full illumination are higher for −Δ tests than for +Δ tests, whereas mean reflectance thresholds when test objects are under reduced illumination are higher for +Δ tests than for −Δ tests. Therefore, mean reflectance thresholds for object-correct functions agree with the material identification asymmetries shown by the chi-square tests.
Figure 10.
Mean reflectance thresholds for material identification in Experiment 1a for conditions of positive delta test objects versus negative delta test objects.
From the asymmetries in the results of Experiment 1a, the question arises whether a single perceptual strategy can account for both identification failures and successes. When looking at the material identification data, it is helpful to think about possible strategies observers could use. The difference in illumination between the two compartments (a factor of 4) is much greater than the difference in mean reflectance between standards and test (a few percent). Whenever the test object is in the compartment with full illumination, the object on that side with the highest mean reflectance will be most different in mean luminance, whether or not it is the odd object. Conversely, whenever the test object is in the compartment with reduced illumination, the object on that side with the lowest mean reflectance will be most different in mean luminance. Therefore, if observers made judgments based strictly on the mean luminances of the objects alone, they would respond correctly half the time; that is, when higher mean reflectance tests are under full illumination and when lower mean reflectance tests are under reduced illumination. Under the other half of stimuli conditions, they would consistently choose the incorrect objects and the proportion of correct responses would fall below chance towards zero.
On the other hand, there is sufficient information in the displays to perform the task accurately using reverse optics. If an observer could take precise mean luminance ratios between the backgrounds, this would provide an estimate of the relative intensities of the two illuminants. This estimate could be used to discount the mean luminance differences between the objects. In this case, identification across compartments would be as good as discrimination within a compartment.
The actual data show that observer responses are between these two extremes. One possibility is that observers are basing their responses on perceived brightness. We propose a model where the brightness of a stimulus is equal to its mean luminance multiplied by a scalar gain whose value is a monotonically decreasing function of mean luminance within a compartment (Hayhoe, Benimoff, & Hood, 1987; Zaidi, Shapiro, & Hood, 1992). Because the backgrounds of the compartments have equal mean reflectances, their luminance values can be related to the amount of illumination they receive. According to this model, the gain (g) is equal to 1.0 when the compartment’s mean luminance (L) is equal to 0.0 and declines monotonically as illumination increases. The rate of decline is governed by the free parameter (κ), that is, g = κ / (κ + L).
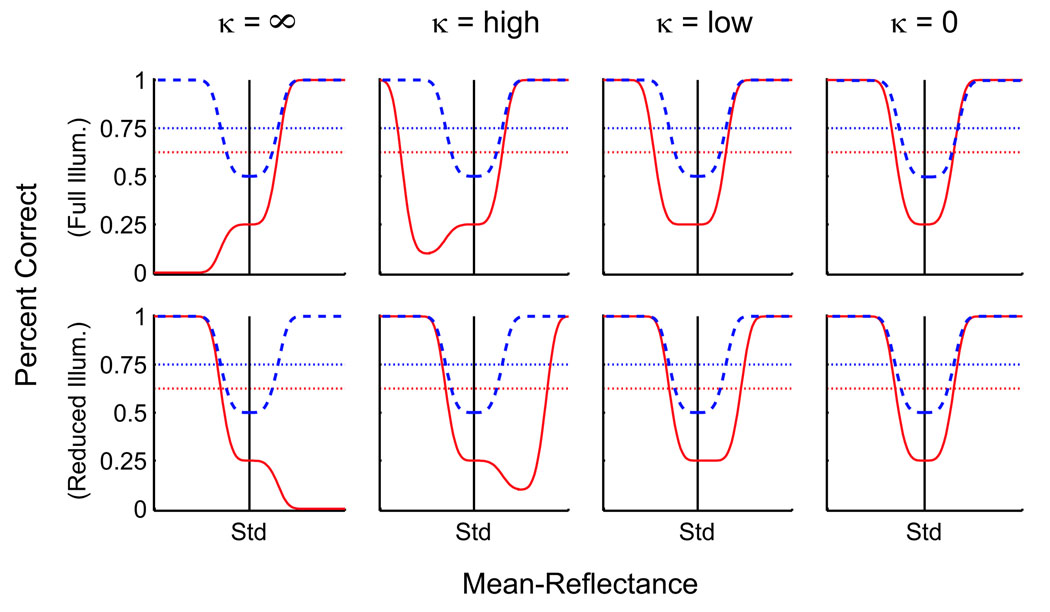
If observers were to make decisions of lightness identification based on perceived brightness dissimilarities, their response results would vary depending on the amount of adaptation. Figure 11 shows examples of four such pairs of response curves in which perceived brightness is being adapted to four different degrees based on the value of κ. The top row simulates test objects under full illumination, whereas the bottom row simulates test objects under reduced illumination. The leftmost pair (κ = ∞) represents an observer with no brightness adaptation, in which lightness dissimilarities will be based strictly on mean luminance. Here there is complete asymmetry between the brightness discrimination and lightness identification curves. The direction of the asymmetry depends on whether the tests are under full or reduced illumination. The rightmost pair (κ = 0) represents complete brightness adaptation, in which the standards will appear equal across illuminants. Here, lightness identification curves will be symmetrical and lightness identification will be limited only by brightness discrimination within illuminants. The asymmetry seen in the actual data of Experiment 1 is somewhere in between these two extreme examples. The two middle pairs of Figure 11 show that when a certain amount of adaptation occurs, the standard in the test’s compartment will appear closer to the standards on the other side when the difference between standard and test is high. With more adaptation (lower κ), less difference between standard and test is needed for correct identification. This model approximates the asymmetries seen in Experiment 1a and also explains why object-correct proportions can be below chance level. This suggests that perceived brightness is the factor observers use to identify reflectance across illuminants. This is tested directly in Experiment 2 by having observers explicitly identify brightness differences.
Figure 11.
Hypothetical material identification functions based on brightness adaptation.
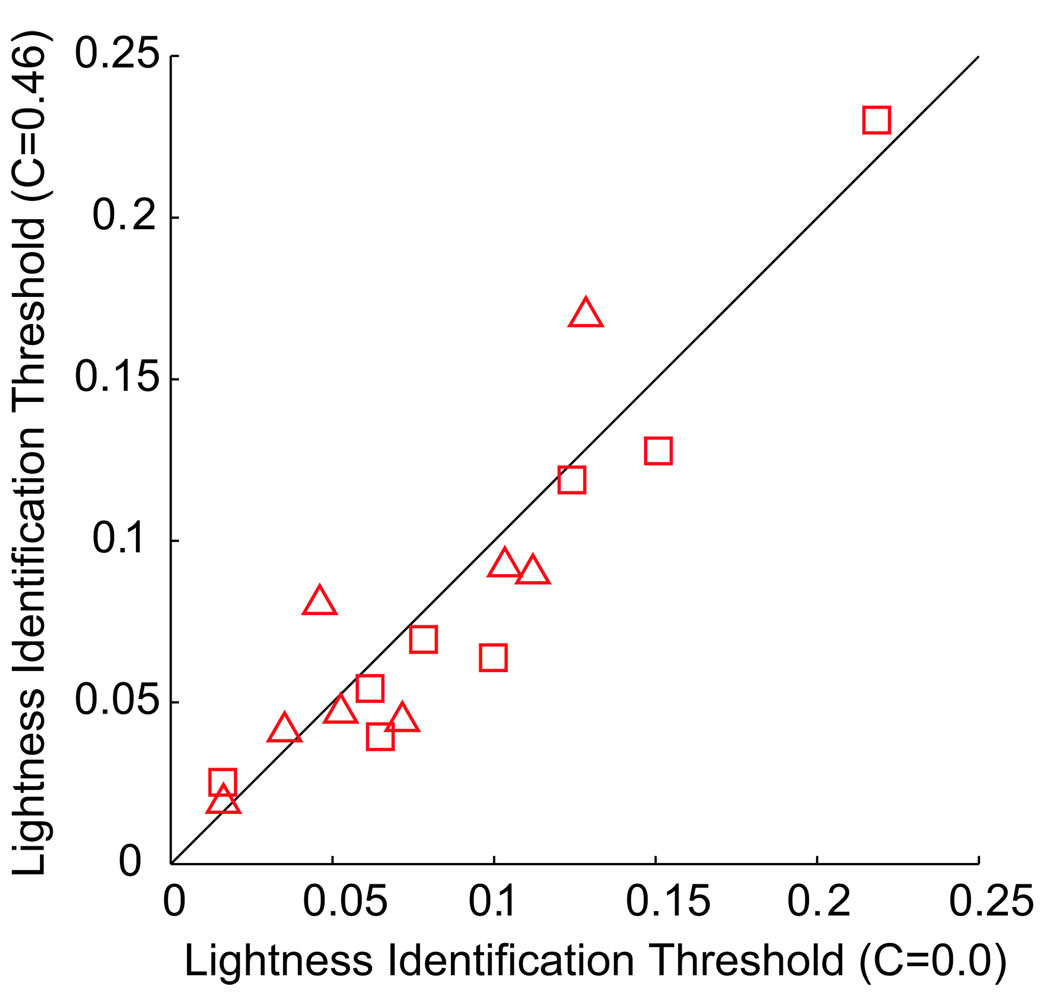
A question of particular interest with using real patterned objects is how well do the patterns aid in identifying lightness. This can be examined by comparing results for standard stimuli in Experiment 1a that were the same in mean reflectance and differed in reflectance contrast. Figure 12 compares lightness identification for the 0.0 reflectance contrast (plain gray) stimuli to the 0.46 reflectance contrast (patterned) stimuli. Squares represent the mean reflectance thresholds for observer BV, whereas triangles represent observer JC’s thresholds. Patterned conditions have lower thresholds in 10 of the 16 conditions. This is suggestive but not significant by Fisher’s randomization test. Under the experimental conditions in this study, pattern contrast does not appear to improve lightness identification significantly. It also seems that perceived brightness is not affected by perceived contrast in the material identification task.
Figure 12.
Mean reflectance thresholds for patterned versus nonpatterned conditions.
Material identification for varying reflectance contrast
In Experiment 1b, mean reflectances were fixed, and test objects varied from their standards only in reflectance contrast. As with Experiment 1a, if observers were to perfectly account for illuminant changes when identifying materials across the different environments, their ability to identify the correct object would be limited solely by their ability to discriminate contrast differences within each compartment. We tested this using the same chi-square test and the values are included with the graphs in Figure 8B. Values greater than the critical value are in bold and labeled with asterisks, signifying conditions where the hypothesis that identification is limited only by discrimination can be rejected. Based on this analysis, the results display a weaker and different asymmetry than in Experiment 1a. Combined for both observers, the hypothesis is more likely to be rejected when test objects are in the reduced illumination compartment (9/16 times), as opposed to the full illumination compartment (3/16 times).
The results of Experiment 1b does reveal a discrimination bias for observers to choose one of the objects in the darker compartment when the difference between the reflectance contrast levels of the test and standard is near threshold level. This is evident in the side-correct functions having steeper curves and lower thresholds in conditions where the tests objects are on the side of reduced illumination (i.e., lower subplots of the vertical pairs). This trend across both observers in Experiment 1b can be seen in Figure 13A. Here, reflectance contrast levels that give side-correct thresholds are plotted for conditions of full illumination versus reduced illumination. Combined for both observers, test objects under reduced illumination resulted in lower thresholds for 14 of 16 conditions. A similar bias for object-correct thresholds for the same conditions was not as apparent (Figure 13B).
Figure 13.
(A) Detection and (B) identification thresholds of Experiment 1b for conditions of “test objects under full illumination” versus “test objects under reduced illumination”. Squares and triangles represent observers BV and LC, respectively.
The bias toward choosing test objects in the compartment with reduced illumination may mask asymmetries of material identification as tested for by the chi-square test. For a direct comparison, Figure 14 compares identification thresholds for +Δ tests versus −Δ tests. Figure 14A represents tests under full illumination whereas Figure 14B represents test under reduced illumination. In the plots, data points from BV are represented by squares and JC by triangles.
Figure 14.
Reflectance contrast thresholds for material identification in Experiment 1b for conditions of positive delta test objects versus negative delta test objects.
Reflectance contrast thresholds for object-correct functions show a slight asymmetry for conditions of full illumination (+Δ tests have equal or greater thresholds in six of eight conditions) and a more significant asymmetry for conditions of reduced illumination (−Δ tests have equal or greater thresholds in all eight conditions).
For each set of stimuli in Experiment 1b, mean reflectance is equal. Any perceptual strategy that observers use to identify materials must take advantage of the contrast dissimilarities. The question that arises is whether there is any single strategy that uses contrast differences that can account for the asymmetries in material identification.
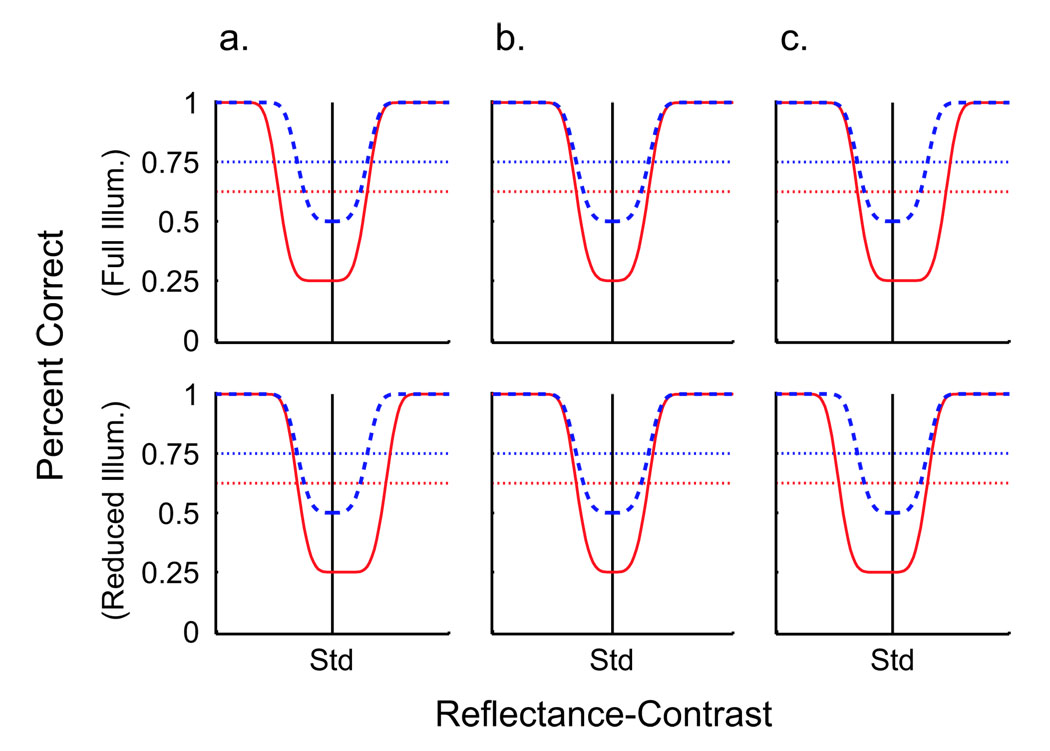
Different patterns of contrast-based material identification can be predicted based on different interactions between illumination, mean luminance, and surface scatter. Figure 15 shows three hypothetical responses to the identification task with varying contrast. For each vertical pair, the top plot represents conditions in which the tests are in the compartment under full illumination, whereas in the bottom plot the tests are under reduced illumination. Side-and object-correct thresholds are represented in each subplot by the upper blue line and lower red line, respectively. All three models assume that observers discriminate contrast differences within illuminants equally and therefore have identical side-correct functions.
Figure 15.
Hypothetical material identification functions based on perceived contrast models.
Figure 15A predicts the outcome based on the assumption that perceived contrast of surface patterns increases with mean luminance. If this is true, when contrast differences between test and standard are small, lower contrast tests in the fully illuminated compartment will appear more similar in perceived contrast to the higher contrast standards in the darker compartment. Conversely, higher contrast tests in the darker compartment will appear more similar in perceived contrast to the lower contrast standards in the fully illuminated compartment. This will lower the proportion of object-correct responses for lower contrast tests under full illumination, and for higher contrast tests under reduced illumination. For these conditions, the predicted identification curves are shifted away from the standard and require more reflectance difference to reach threshold compared to discrimination curves.
Figure 15B predicts the veridical outcome of an observer who uses reflectance contrast of the surface pattern that is invariant to illuminant energy. This outcome would be predicted if perceived contrast is constant across illumination changes, and if luminance contrast is always identical to reflectance contrast. Identification across illuminants would be limited only by the ability to discriminate within illuminants. Predicted discrimination and identification thresholds are reached at the same difference in test contrast regardless of the direction of the contrast difference or illumination condition.
The identification curves in Figure 15C have the opposite asymmetry to those in Figure 15A. There are two possible reasons for this asymmetry. First, the perceived contrast of a surface pattern may increase with decreasing luminance. Second, any surface roughness will cause multiple scattering that adds a component to the reflections due to direct illumination and surface scattering (Koenderink, Van Doorn, Dana, & Nayar, 1999). Because the added scatter component increases with increasing illumination, luminance contrast will be less than reflectance contrast as a function of illumination intensity and surface roughness. Because low gloss paper is close to Lambertian, the perceptual effect is probably larger. In informal observations, we simulated lower illumination on one half of a compartment by attaching a neutral density filter to the front. In this case, surface scatter should be identical for both objects in the compartment, but the object behind the filter appeared to be of a higher contrast. It is possible that the darkest portion of the plaid plays a disproportionately larger role in contrast judgment as it does in preattentive discrimination of achromatic textures (Chubb, Landy, & Econopouly, 2004). If this is true, when contrast differences between test and standard are small, higher contrast tests in the fully illuminated compartment will appear more similar in perceived contrast to the lower contrast standards in the darker compartment. Conversely, lower contrast tests in the darker compartment will appear more similar in perceived contrast to the higher contrast standards in the fully illuminated compartment. This will lower the proportion of object-correct responses for higher contrast tests under full illumination, and for lower contrast tests under reduced illumination. For these conditions, the predicted identification curves are shifted away from the standard and require more reflectance difference to reach threshold compared to discrimination curves.
Of the three sets of hypothetical curves, the actual results from Experiment 1b are most similar to Figure 15C. The illumination-based asymmetries predicted by Figure 15C are also seen in the identification threshold results as plotted in Figure 14. This suggests that observers use perceived contrast dissimilarity to identify objects, and the bias is due to small perceived contrast inconstancies.
Experiment 2—Identification based on brightness dissimilarities
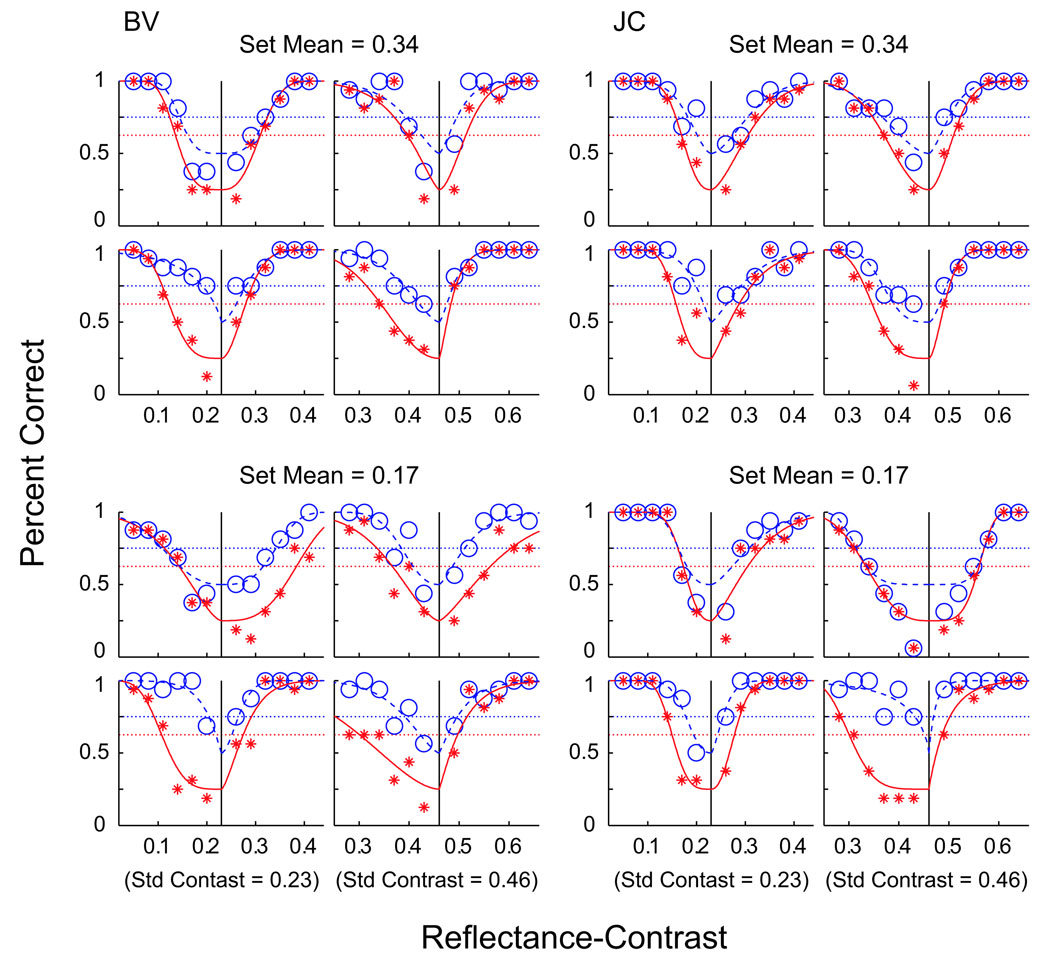
The procedure for Experiment 2 differed from Experiment 1 only in the instructions to the observers. Instead of choosing the one object different from the other three, observers were now explicitly instructed to choose the object most different in perceived brightness. The important distinction is that the task shifted from identification based on physical dissimilarity to identification based on perceptual dissimilarity. Results from both observers are presented in Figure 16. To test whether the results of Experiment 1a could be predicted from direct brightness dissimilarity judgments, we have plotted the results of Experiment 2 in a format identical to Figure 8A. Percent correct is defined as the proportion of responses in which the object chosen as most different in perceived brightness was also the test object. In other words, these results would be obtained if identification was based on perceived brightness dissimilarities. BV’s data are plotted in the left half of the figure, whereas JC’s data are plotted in the right. Note that only the sets of stimuli that varied in mean reflectance were used.
Figure 16.
Results from Experiment 2. Proportion of correct response versus mean reflectance of test objects.
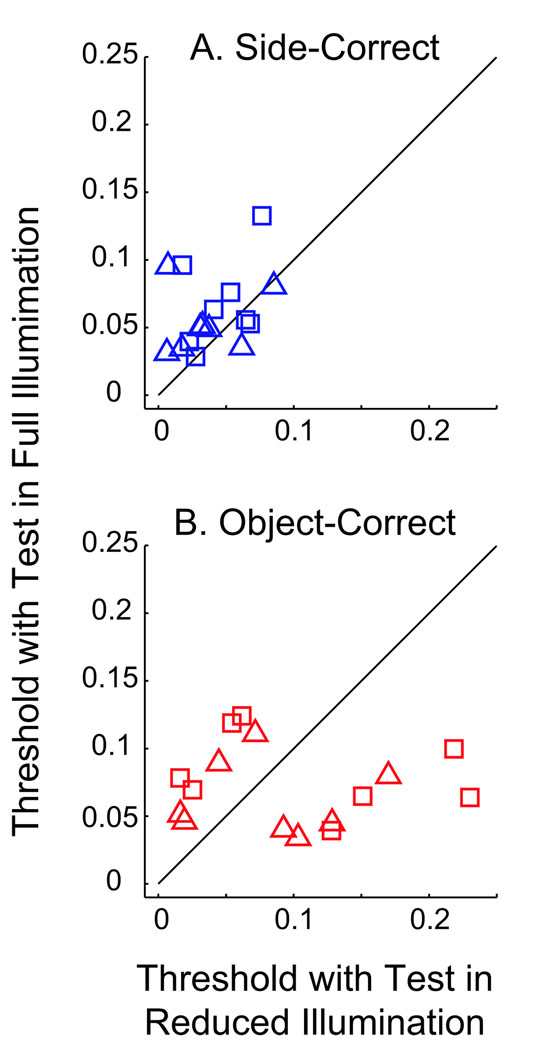
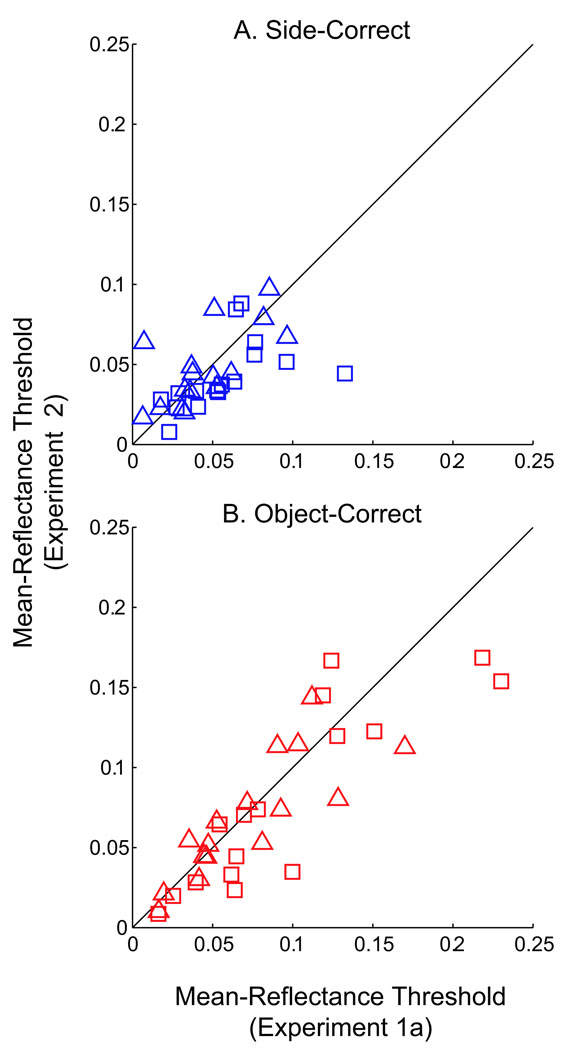
For conditions of lower mean reflectance tests under full illumination, and higher mean reflectance tests under reduced illumination, identification thresholds are higher relative to their side-discrimination thresholds. Despite the difference in task, the data from Experiment 2 show patterns similar to Experiment 1a. The brightness identification curves in Experiment 2 have the same systematic asymmetries as the material identification curves of Experiment 1a. For test objects of lower mean reflectance under full illumination and test objects of higher mean reflectance under reduced illumination, identification thresholds are increased relative to their side-discrimination thresholds. A direct comparison between threshold results is presented in Figure 17. Here, mean reflectance thresholds of Experiment 1a are plotted against the mean reflectance thresholds for corresponding stimuli conditions in Experiment 2 for both side-correct (Figure 17A) and object-correct (Figure 17B) responses. Squares represent observer BV, whereas triangles represent JC. For each observer, the majority of data points fall near the unit diagonal, indicating equal threshold values between experiments.
Figure 17.
Mean reflectance thresholds for (A) side-correct and (B) object-correct functions from Experiment 2 versus Experiment 1a.
The identification asymmetry within Experiment 2 for the different illuminant conditions is also consistent with the model illustrated in Figure 11 in which lightness identification is based on mean luminance of the object plus adaptation from the local surround. This suggests that perceived brightness was the cue observers were using in Experiment 1a.
Experiment 3—Identification based on contrast dissimilarities
The procedure for Experiment 3 differed from Experiment 1 only in the instructions to the observer. Instead of choosing the one object different from the other three, observers were now explicitly instructed to choose the object most different in perceived contrast. As with Experiment 2, the important distinction is that the task shifted from physically based identification to perceptually based identification. Results from both observers are presented in Figure 18. To test whether the results of Experiment 1b could be predicted from direct perceived contrast dissimilarity judgments, we have plotted the results of Experiment 3 in a format identical to Figure 8B. Percent correct is defined as the proportion of responses in which the object chosen as most different in perceived contrast was also the test object. BV’s data are plotted in the left half of the figure, whereas JC’s data are plotted in the right. Note that only the sets of stimuli that varied in reflectance contrast were used.
Figure 18.
Results from Experiment 3. Proportion of correct response versus reflectance contrast of test objects.
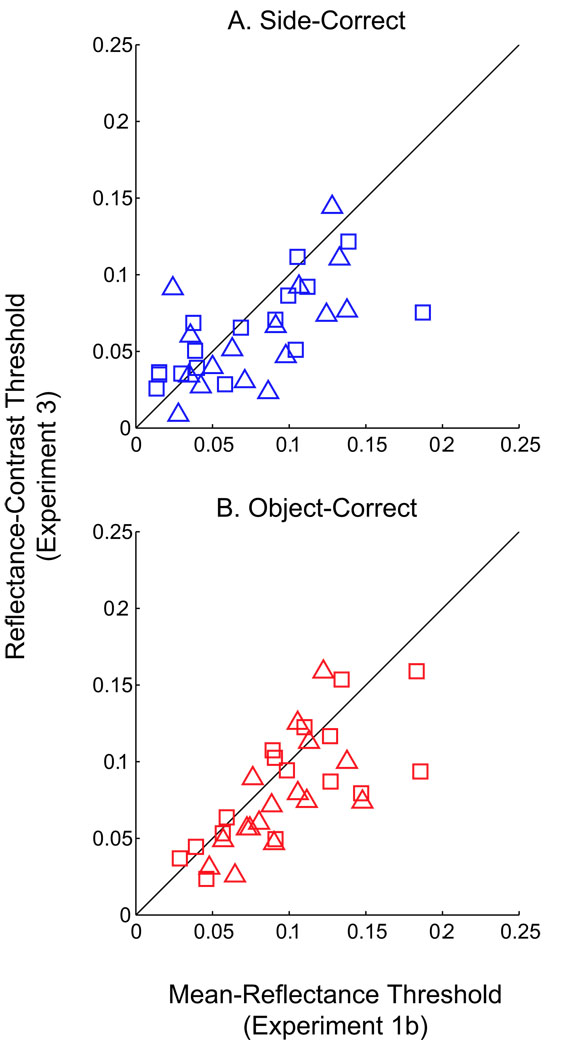
Results from Experiment 3 are similar to the results in Experiment 1b. The contrast identification curves in Experiment 3 have the same systematic asymmetries as the material identification curves of Experiment 1a. In particular, for test objects of lower reflectance contrast under reduced illumination, thresholds are increased relative to their side-discrimination thresholds. A direct comparison of threshold results between Experiments 1b and 3 is presented in Figure 19. Here, reflectance contrast thresholds of the two experiments are plotted against each other for both side-correct (Figure 19A) and object-correct (Figure 19B) responses. Squares represent observer BV, whereas triangles represent JC. The majority of data points are clustered near the unit diagonal, indicating equal thresholds values. This suggests that observers were using perceived contrast to identify materials in Experiment 1b.
Figure 19.
Reflectance contrast thresholds for (A) side-correct and (B) object-correct functions from Experiment 3 versus Experiment 1b.
Discussion
Most studies of lightness perception use computer-generated, plain stimuli-assuming Lambertian reflectance. However, most surfaces in the world are neither flat nor Lambertian. Some advantages of binocularly viewed, complex, 3-D real stimuli are that they provide many cues missing from computer simulations and from flat stimuli. The crumpled materials used in these studies exhibit shadows, highlights, and shape-based illumination gradients. All of these cues can help in extracting reflectance (Montag & Berns, 2000; Nayar & Oren, 1995; Nishida & Shinya, 1998) and estimating illuminants (Maloney, 2002). Shape cues such as occlusion, object curvature, and perspective give information regarding illumination direction that could also aid lightness perception (Adelson & Pentland, 1996; Pessoa, Mingolla, & Arend, 1996; Sun & Perona, 1996). These naturalistic cues can contribute to the correct classification of surface contrast and reflection versus illumination variations across the scene.
Moving towards even more naturalistic stimuli, the patterned 3-D objects of the current study provide the additional cue of internal reflectance contrast between different parts of a single paper’s surface. This internal reflectance contrast is immune to illumination levels except for surface scatter, which is a function of surface roughness. The paper used in the current study was fairly smooth, so there was only a small amount of light scatter. As additional cues, patterns allow use of reflectance extremes or reflectance ranges to supplement mean reflectance. When surfaces are separated in space so that they cannot all be attended to simultaneously in a single glance, visual memory has to be used in comparing their appearances. Memory for contrast is substantially better than memory for gray levels (Sachtler & Zaidi, 1992).
Under everyday conditions, observers consistently judge surfaces as having a certain lightness. This subjective impression points out the tendency to use reflectance in mental representations of surfaces. This phenomenological experience however is not sufficient evidence that the visual system has access to the physical reflectance of materials. In a reverse optics model of lightness perception, observers first estimate illuminant intensity and then extract relative lightness by discounting the illuminant (Beck, Prazdny, & Ivry, 1984; Katz, 1935; Koffka, 1935; Kozaki & Noguchi, 1976; Logvinenko & Menshikova, 1994; Noguchi & Kozaki, 1985; Woodworth, 1938). To estimate relatively veridical reflectance, a scene would have to contain sufficient information to perform this task, and a visual system would have to have the capability of utilizing this information. Our results show that despite naturalistic binocular viewing of information-rich situations, under many conditions, observers cannot identify objects of the same reflectance across different illumination levels. A reverse optics model has also been questioned based on a two-stage matching paradigm (Rutherford & Brainard, 2002).
As stated in the Introduction, previous studies on lightness perception have found that observers’ results cannot be explained exactly by lightness matching or luminance matching (Adelson, 2000; Land & McCann, 1971; Ripamonti et al., 2004; Rutherford & Brainard, 2002; Thouless, 1931; Woodworth, 1938). We were therefore interested in identifying the percepts that underlie reflectance identification across illumination conditions. In the achromatic domain, the simplest percepts are perceived brightness and perceived contrast. We show that these percepts are used in identification of patterned 3-D objects across illumination conditions. This assertion is based on two types of evidence. First, asymmetries in the shapes of the identification psychometric functions can be simulated by simple adaptation models that perform object identification based on brightness or contrast dissimilarity. Second, the identification asymmetries can be recreated by using observers’ judgments of brightness or contrast dissimilarity. As a result, this study argues for reflectance identification based on perceptual heuristics and against a reverse optics model.
Is internal pattern contrast useful in material identification across lighting conditions? Identification performance for patterned versus plain surfaces can only be compared along the dimension of mean reflectance. The presence of contrast did not affect identification when objects differed solely in mean reflectance, and observers seemed to use similar overall brightness strategies for patterned and plain papers. Observers did use perceived pattern contrast in object identification when objects differed in reflectance contrast. Perceived pattern contrast seemed to be an inverse function of mean luminance. Perceived pattern contrast will therefore be an aid in identifying patterned surfaces but will lead to biased identifications across large illumination differences.
Acknowledgments
The authors thank Bill Swanson, Hal Sedgwick, Manish Singh, and Andrea Li for their helpful comments. This work was made possible by NEI grants EY07556 and EY13312 to QZ. Presented in part at the annual meeting of the Association for Research in Vision and Ophthalmology, Fort Lauderdale, Florida, 2005 (Robilotto & Zaidi, 2005).
Footnotes
Commercial relationships: none.
Contributor Information
Rocco Robilotto, Email: rrobilotto@sunyopt.edu.
Qasim Zaidi, Email: qz@sunyopt.edu.
References
- Adelson EH. Lightness perception and lightness illusions. In: Gazzaniga M, editor. The new cognitive neurosciences. 2nd ed. Cambridge, MA: MIT Press; 2000. pp. 339–351. [Google Scholar]
- Adelson EH, Pentland AP. The perception of shading and reflectance. In: Knill D, Richards W, editors. Perception as Bayesian inference. New York: Cambridge University Press; 1996. pp. 409–423. [Google Scholar]
- Anderson BL. A theory of illusory lightness and transparency in monocular and binocular images: The role of contour junctions. Perception. 1997;26(4):419–453. doi: 10.1068/p260419. [DOI] [PubMed] [Google Scholar]
- Arend LE, Goldstein R. Simultaneous constancy, lightness, and brightness. Journal of the Optical Society of America A. 1987;4(12):2281–2285. doi: 10.1364/josaa.4.002281. [DOI] [PubMed] [Google Scholar]
- Arend LE, Reeves A. Simultaneous color constancy. Journal of the Optical Society of America A. 1986;3(10):1743–1751. doi: 10.1364/josaa.3.001743. [DOI] [PubMed] [Google Scholar]
- Arend LE, Spehar B. Lightness, brightness, and brightness contrast: 1. Illuminance variation. Perception and Psychophysics. 1993a;54(4):446–456. doi: 10.3758/bf03211767. [DOI] [PubMed] [Google Scholar]
- Arend LE, Spehar B. Lightness, brightness, and brightness contrast: 2. Reflectance variation. Perception and Psychophysics. 1993b;54(4):457–468. doi: 10.3758/bf03211768. [DOI] [PubMed] [Google Scholar]
- Beck J, Prazdny K, Ivry R. The perception of transparency with achromatic colors. Perception and Psychophysics. 1984;35(5):407–422. doi: 10.3758/bf03203917. [DOI] [PubMed] [Google Scholar]
- Bloj M, Ripamonti C, Mitha K, Hauck R, Green-wald S, Brainard DH. An equivalent illuminant model for the effect of surface slant on perceived lightness. Journal of Vision. 2004;4(9):735–746. doi: 10.1167/4.9.6. [DOI] [PubMed] [Google Scholar]
- Boyaci H, Doerschner K, Maloney LT. Perceived surface color in binocularly viewed scenes with two light sources differing in chromaticity. Journal of Vision. 2004;4(9):664–679. doi: 10.1167/4.9.1. [DOI] [PubMed] [Google Scholar]
- Boyaci H, Maloney LT, Hersh S. The effect of perceived surface orientation on perceived surface albedo in binocularly viewed scenes. Journal of Vision. 2003;3(8):541–553. doi: 10.1167/3.8.2. [DOI] [PubMed] [Google Scholar]
- Bruno N. Failures of lightness constancy, edge integration, and local edge enhancement. Vision Research. 1994;34(17):2205–2214. doi: 10.1016/0042-6989(94)90103-1. [DOI] [PubMed] [Google Scholar]
- Chevreul ME. De la loi du contraste simultane des couleurs. Paris: Pitois-Levreault; 1839. [Google Scholar]
- Chubb C, Landy MS, Econopouly J. A visual mechanism tuned to black. Vision Research. 2004;44(27):3223–3232. doi: 10.1016/j.visres.2004.07.019. [DOI] [PubMed] [Google Scholar]
- Chubb C, Sperling G, Solomon JA. Texture interactions determine perceived contrast. Proceedings of the National Academy of Science of the United States of America. 1989;86(23):9631–9635. doi: 10.1073/pnas.86.23.9631. [DOI] [PMC free article] [PubMed] [Google Scholar]
- Craik KJW. The effect of adaptation on differential brightness discrimination. Journal of Physiology. 1938;92:406–421. doi: 10.1113/jphysiol.1938.sp003612. [DOI] [PMC free article] [PubMed] [Google Scholar]
- De Bonet JS, Zaidi Q. Comparison between spatial interactions in perceived contrast and perceived brightness. Vision Research. 1997;37:1141–1155. doi: 10.1016/s0042-6989(96)00250-7. [DOI] [PubMed] [Google Scholar]
- Doerschner K, Boyaci H, Maloney LT. Human observers compensate for secondary illumination originating in nearby chromatic surfaces. Journal of Vision. 2004;4(2):92–105. doi: 10.1167/4.2.3. [DOI] [PubMed] [Google Scholar]
- Fleming RW, Dror RO, Adelson EH. Real-world illumination and the perception of surface reflectance properties. Journal of Vision. 2003;3(5):347–368. doi: 10.1167/3.5.3. [DOI] [PubMed] [Google Scholar]
- Georgeson MA. The effect of spatial adaptation on perceived contrast. Spatial Vision. 1985;1(2):103–112. doi: 10.1163/156856885x00125. [DOI] [PubMed] [Google Scholar]
- Georgeson MA, Sullivan GD. Contrast constancy: Deblurring in human vision by spatial frequency channels. Journal of Physiology. 1975;252(3):627–656. doi: 10.1113/jphysiol.1975.sp011162. [DOI] [PMC free article] [PubMed] [Google Scholar]
- Gilchrist A, Kossyfidis C, Bonato F, Agostini T, Cataliotti J, Li X, et al. An anchoring theory of lightness perception. Psychological Review. 1999;106(4):795–834. doi: 10.1037/0033-295x.106.4.795. [DOI] [PubMed] [Google Scholar]
- Gilchrist AL. Lightness contrast and failures of constancy: A common explanation. Perception and Psychophysics. 1988;43(5):415–424. doi: 10.3758/bf03207877. [DOI] [PubMed] [Google Scholar]
- Gilchrist AL, Annan V., Jr Articulation effects in lightness: Historical background and theoretical implications. Perception. 2002;31(2):141–150. doi: 10.1068/p04sp. [DOI] [PubMed] [Google Scholar]
- Gilchrist AL, Jacobsen A. Perception of lightness and illumination in a world of one reflectance. Perception. 1984;13(1):5–19. doi: 10.1068/p130005. [DOI] [PubMed] [Google Scholar]
- Hayhoe MM, Benimoff NI, Hood DC. The time-course of multiplicative and subtractive adaptation process. Vision Research. 1987;27(11):1981–1996. doi: 10.1016/0042-6989(87)90062-9. [DOI] [PubMed] [Google Scholar]
- Helson H. Adaptation-level theory. New York: Harper and Row; 1964. [Google Scholar]
- Kardos L. Thing and shadow: An experimental study of the foundations of color vision. Zeitschrift fur Psychologie. 1934;23:1–184. [Google Scholar]
- Katz D. In: The world of color. MacLeod RB, Fox CW, translators. London: Kegan, Paul, Trench Truber & Co. Ltd; 1935. [Google Scholar]
- Khang B-G, Zaidi Q. Cues and strategies for color constancy: Perceptual scission, image junctions and transformational color matching. Vision Research. 2002;42(2):211–226. doi: 10.1016/s0042-6989(01)00252-8. [DOI] [PubMed] [Google Scholar]
- Koenderink JJ, Van Doorn AJ, Dana KJ, Nayar S. Bidirectional reflectance distribution function of thoroughly pitted surfaces. International Journal of Computer Vision. 1999;31(23):129–144. [Google Scholar]
- Koffka K. Principles of Gestalt psychology. New York: Harcourt, Brace, and Company; 1935. [Google Scholar]
- Kozaki A, Noguchi K. The relationship between perceived surface lightness and perceived illumination: A manifestation of perceptual scission. Psychological Research. 1976;39(1):1–16. doi: 10.1007/BF00308942. [DOI] [PubMed] [Google Scholar]
- Kulikowski JJ. Effective contrast constancy and linearity of contrast sensation. Vision Research. 1976;16(12):1419–1431. doi: 10.1016/0042-6989(76)90161-9. [DOI] [PubMed] [Google Scholar]
- Land EH, McCann JJ. Lightness and retinex theory. Journal of the Optical Society of America. 1971;61(1):1–11. doi: 10.1364/josa.61.000001. [DOI] [PubMed] [Google Scholar]
- Logvinenko A, Menshikova G. Trade-off between achromatic colour and perceived illumination as revealed by the use of pseudoscopic inversion of apparent depth. Perception. 1994;23(9):1007–1023. doi: 10.1068/p231007. [DOI] [PubMed] [Google Scholar]
- MacMillan NA, Creelman CD. Detection theory: A user’s guide. New York: Cambridge University Press; 1991. [Google Scholar]
- Maloney LT. Illuminant estimation as cue combination. Journal of Vision. 2002;2(6):493–504. doi: 10.1167/2.6.6. [DOI] [PubMed] [Google Scholar]
- Montag ED, Berns RS. Lightness dependencies and the effect of texture on suprathreshold lightness tolerances. Color Research Applications. 2000;25(4):241–249. [Google Scholar]
- Nayar SK, Oren M. Visual appearance of matte surfaces. Science. 1995;267(5201):1153–1156. doi: 10.1126/science.7855592. [DOI] [PubMed] [Google Scholar]
- Nishida S, Shinya M. Use of image-based information in judgments of surface-reflectance properties. Journal of the Optical Society of America A. 1998;15(12):2951–2965. doi: 10.1364/josaa.15.002951. [DOI] [PubMed] [Google Scholar]
- Noguchi K, Kozaki A. Perceptual scission of surface-lightness and illumination: An examination of the Gelb effect. Psychological Research. 1985;47(1):19–25. doi: 10.1007/BF00309215. [DOI] [PubMed] [Google Scholar]
- Peli E. Suprathreshold contrast perception across differences in mean luminance: Effects of stimulus size, dichoptic presentation, and length of adaptation. Journal of the Optical Society of America A. 1995;12(5):817–823. doi: 10.1364/josaa.12.000817. [DOI] [PubMed] [Google Scholar]
- Peli E, Arend L, Labianca AT. Contrast perception across changes in luminance and spatial frequency. Journal of the Optical Society of America A. 1996;13(10):1953–1959. doi: 10.1364/josaa.13.001953. [DOI] [PubMed] [Google Scholar]
- Peli E, Yang JA, Goldstein R, Reeves A. Effect of luminance on suprathreshold contrast perception. Journal of the Optical Society of America A. 1991;8(8):1352–1359. doi: 10.1364/josaa.8.001352. [DOI] [PubMed] [Google Scholar]
- Pessoa L, Mingolla E, Arend LE. The perception of lightness in 3-D curved objects. Perception and Psychophysics. 1996;58(8):1293–1305. doi: 10.3758/bf03207560. [DOI] [PubMed] [Google Scholar]
- Ripamonti C, Bloj M, Hauck R, Mitha K, Greenwald S, Maloney SI, et al. Measurements of the effect of surface slant on perceived lightness. Journal of Vision. 2004;4(9):747–763. doi: 10.1167/4.9.7. [DOI] [PubMed] [Google Scholar]
- Robilotto R, Zaidi Q. Limits of lightness identification for real objects under natural viewing conditions. Journal of Vision. 2004a;4(9):779–797. doi: 10.1167/4.9.9. (Appendices 5.1 and 5.2) [DOI] [PubMed] [Google Scholar]
- Robilotto R, Zaidi Q. Perceived transparency of neutral density filters across dissimilar backgrounds. Journal of Vision. 2004b;4(3):183–195. doi: 10.1167/4.3.5. [DOI] [PubMed] [Google Scholar]
- Robilotto R, Zaidi Q. Perceptual strategies for the identification of patterned 3-D real objects across illuminants. Investigative Ophthalmology and Visual Science. 2005;46:4688. E-Abstract. [Google Scholar]
- Rutherford MD, Brainard DH. Lightness constancy: A direct test of the illumination-estimation hypothesis. Psychological Science. 2002;13(2):142–149. doi: 10.1111/1467-9280.00426. [DOI] [PubMed] [Google Scholar]
- Sachtler WL, Zaidi Q. Chromatic and luminance signals in visual memory. Journal of the Optical Society of America A. 1992;9(6):877–894. doi: 10.1364/josaa.9.000877. [DOI] [PubMed] [Google Scholar]
- Schirillo JA, Arend LE. Illumination change at a depth edge can reduce lightness constancy. Perception and Psychophysics. 1995;57(2):225–230. doi: 10.3758/bf03206509. [DOI] [PubMed] [Google Scholar]
- Sinha P, Adelson EH. Recovering reflectance and illumination in a world of painted polyhedra; Proceedings of the Fourth International Conference on Computer Vision; Berlin, Germany. 1993. [Google Scholar]
- Sun J, Perona P. Early computation of shape and reflectance in the visual system. Nature. 1996;379(6561):165–168. doi: 10.1038/379165a0. [DOI] [PubMed] [Google Scholar]
- Thouless RH. Phenomenal regression to the “real” object. British Journal of Psychology. 1931;22:1–30. [Google Scholar]
- Todorovic D. Lightness and junctions. Perception. 1997;26(4):379–394. doi: 10.1068/p260379. [DOI] [PubMed] [Google Scholar]
- Wallach H. Brightness constancy and the nature of achromatic colors. Journal of Experimental Psychology. 1948;38:310–324. doi: 10.1037/h0053804. [DOI] [PubMed] [Google Scholar]
- Wallach H. The perception of neutral colors. Scientific American. 1963;208:107–116. doi: 10.1038/scientificamerican0163-107. [DOI] [PubMed] [Google Scholar]
- Woodworth RS. Experimental psychology. New York: Henry Holt and Co; 1938. [Google Scholar]
- Wyszecki G, Stiles WS. Color science: Concepts and methods, quantitative data and formulae. 2nd ed. New York: John Wiley & Sons; 1982. [Google Scholar]
- Yang JN, Maloney LT. Illuminant cues in surface color perception: Tests of three candidate cues. Vision Research. 2001;41(20):2581–2600. doi: 10.1016/s0042-6989(01)00143-2. [DOI] [PubMed] [Google Scholar]
- Zaidi Q. Color and brightness induction: From Mach bands to three-dimensional configurations. In: Gegenfurtner KR, Sharpe LT, editors. Color vision: From genes to perception. New York: Cambridge University Press; 1999. [Google Scholar]
- Zaidi Q. The role of adaptation in color constancy. In: Clifford C, Rhodes G, editors. Fitting the mind to the world: Adaptation and after-effects in high-level vision. Vol. 2. Oxford: Oxford University Press; 2005. pp. 103–131. [Google Scholar]
- Zaidi Q, Shapiro A, Hood D. The effect of adaptation on the differential sensitivity of the S-cone color system. Vision Research. 1992;32(7):1297–1318. doi: 10.1016/0042-6989(92)90224-7. [DOI] [PubMed] [Google Scholar]
- Zaidi Q, Spehar B, Shy M. Induced effects of backgrounds and foregrounds in three-dimensional configurations: The role of T-junctions. Perception. 1997;26(4):395–408. doi: 10.1068/p260395. [DOI] [PubMed] [Google Scholar]


