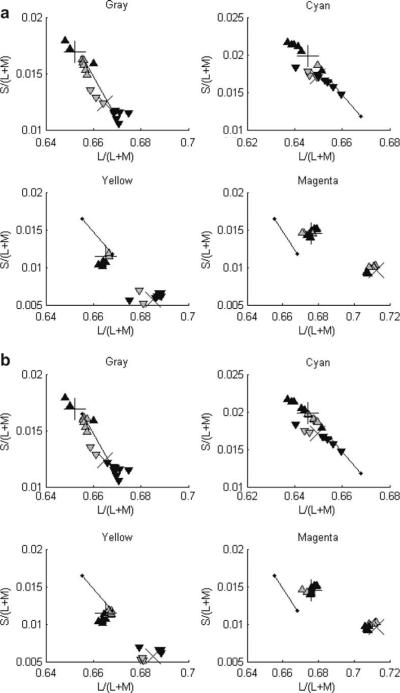
Fig. 7.
Each panel presents identification results for each Standard under each of the two lights for those Tests that could be reliably discriminated. Symbols are used in the same manner as Fig. 6, except that dark triangles represent Tests that were correctly identified (p > .95), gray triangles represent Tests that were misidentified (p > .95). Tests that were neither correctly identified nor misidentified, clustered around the Standard, and are not shown. (a) Observer RH. (b) Observer KS.

