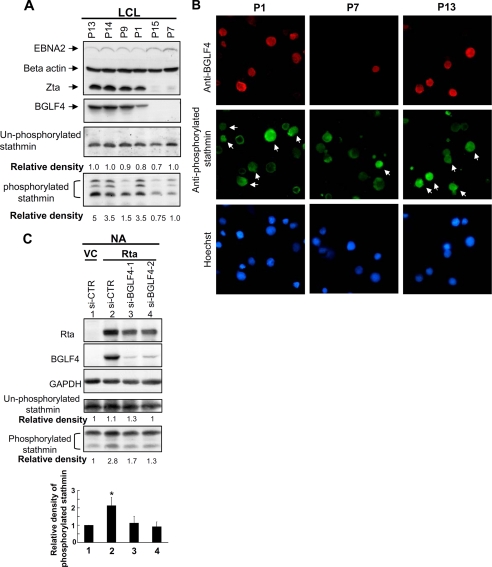
FIGURE 1.
Increasing phosphorylation of stathmin in LCL with spontaneous lytic cycle progression. A, cell lysates were harvested from EBV-transformed LCL cell lines (P1, P7, P9, P13, P14, and P15) and subjected to immunoblotting analysis. Cell lysates were probed by specific antibodies against EBNA2, BGLF4, Zta, phosphorylated stathmin at serine-16, nonphosphorylated stathmin, and β-actin. The band densities of nonphosphorylated and total phosphorylated stathmin of each LCL (P13, P14, P1, and P15) relative to the P7 were quantified and normalized to the intensity of the corresponding internal control using ImageQuant software. These densities are indicated below the corresponding bands. B, P1, P7, and P13 LCL were stained with anti-BGLF4 (red color) and anti-phosphorylated stathmin (green color) antibodies. Nuclear DNA was stained with Hoechst 33258. BGLF4-expressing cells are indicated by arrows. C, an EBV-positive nasopharyngeal cell line, NA, was co-transfected with pSG5-Rta and si-BGLF4-1, si-BGLF4-2 or control siRNA fragments. Cell lysates were harvested 36 h post-transfection and subjected to immunoblotting. The band densities of nonphosphorylated and total phosphorylated stathmin of each transfection relative to the vector and si-CTR transfection (lane 1) were quantified and normalized to the intensity of the corresponding internal control using ImageQuant software. These densities are indicated below the corresponding panels, and relative band densities of phosphorylated stathmin from three independent experiments are statistically analyzed and plotted. *, significant difference from vector control (p < 0.05).

