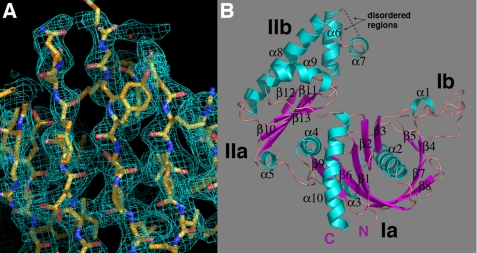
FIGURE 1.
pSK41 ParM structure. A, representative region of the experimental MAD electron density map (blue mesh), contoured at 1.0 σ, for the selenomethionine apo-pSK41 ParM protein. The protein is shown as sticks with carbon, nitrogen, and oxygen colored yellow, blue, and red, respectively. This figure and B, Figs. 2, A and B, 3, A–C, and 4A were made using PyMOL (55). B, overall structure of the apo-pSK41 ParM protein. β-Strands and α-helices are colored magenta and cyan, respectively, and labeled. Also labeled are the N and C termini and subdomains of the molecule. The disordered regions are shown as dotted lines and their locations labeled.

