FIGURE 8.
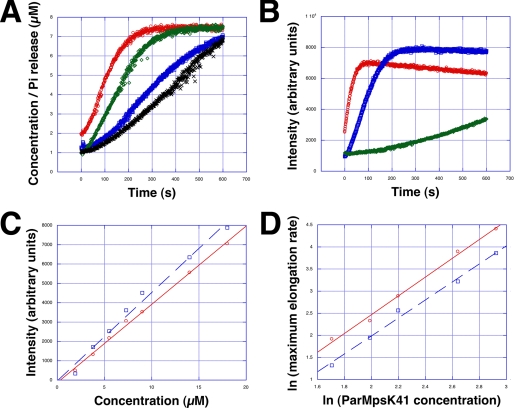
pSK41 ParM polymerization kinetics. A, relationship between the time course of pSK41 ParM polymerization and Pi release. Light scattering units were scaled to the concentration of pSK41 ParM (7.3 μm). Red, pSK41 ParM polymerization in the presence of 2 mm ATP. Green, pSK41 ParM polymerization in the presence of 2 mm GTP. Blue, Pi release from pSK41 ParM-ATP. Black, Pi release from pSK41 ParM-GTP. B, polymerization time courses at 18.6 μm pSK41 ParM. Red, ATP; blue, GTPl; green, AMP-PNP. C, critical concentration of pSK41 ParM. Red, ATP. Blue, GTP. Each data point is the average of three individual experiments. D, the maximal apparent elongation rates. The maximal rates were determined using the light scattering time courses at different pSK41 ParM concentrations as shown for the two examples in A and C. Each data point is the average of three individual experiments.

