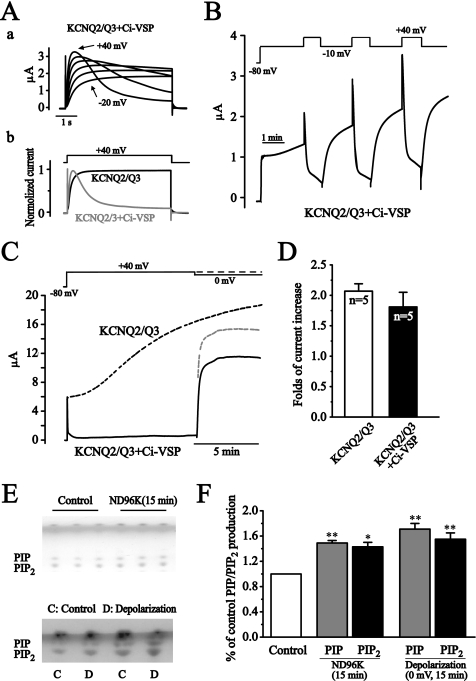
FIGURE 3.
Depolarization increases KCNQ2/Q3 currents through increasing membrane PIP2 level. A, co-expressed Ci-VSP was activated at depolarization potentials and induced an inhibition of KCNQ2/Q3 currents. Aa shows the current traces elicited by depolarization from −20 mV to +40 mV. Ab shows the comparison of the currents elicited by +40 mV depolarization with (gray) or without (black) Ci-VSP coexpression. B, activation of Ci-VSP antagonized the depolarization-induced potentiation of KCNQ2/Q3 current. Lesser depolarization to −10 mV was used to activate KCNQ2/Q3 currents only, whereas larger depolarization to +40 mV was used to activate Ci-VSP. C, activation of Ci-VSP interrupted but did not cancel the depolarization-induced potentiation of KCNQ2/Q3 currents. The black dotted line was an average representative current trace seen for KCNQ2/Q3 alone under the depolarization (+40 mV). The solid line was the KCNQ2/Q3 currents from oocytes co-expressing Ci-VSP, recorded using the protocol shown above (solid line). The gray dotted line presented KCNQ2/3 currents computed as if the membrane were depolarized to +40 mV rather than 0 mV where the currents were measured. D, summary data of fold-current increases from KCNQ2/Q3 only, and KCNQ2/Q3+Ci-VSP oocytes. The currents were measured 10 min after holding the membrane at +40 mV. E, high K+ incubation and depolarization increased PIP and PIP2 levels. Cellular PIP and PIP2 levels were measured using thin layer chromatography (TLC). Oocytes were incubated either in ND96 (control) or in ND96K for 15 min (upper panel), or were held either at −80 mV (control) or 0 mV (depolarization) for 15 min (lower panel). Triplicate (upper panel) or duplicate samples (lower panel) from a single experiment are shown. F, summary data for E. The dots in E were quantified and normalized to the control level. Data are summary of three independent experiments. **, p < 0.01.

