FIGURE 5.
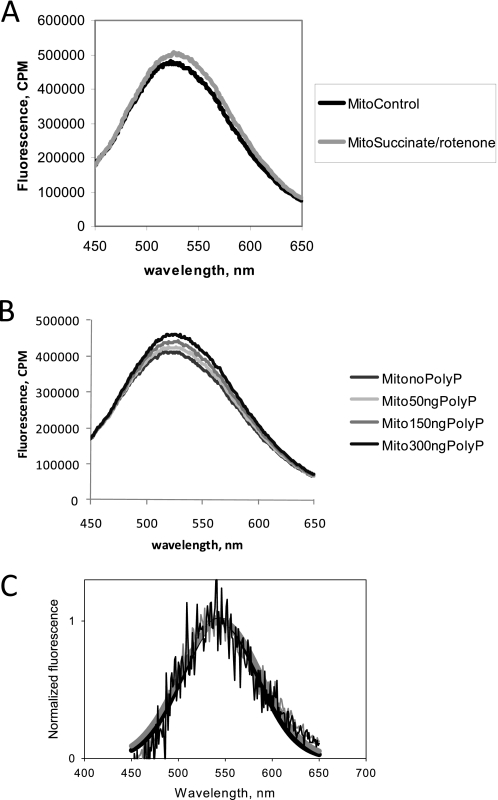
Fluorescence spectrum of DAPI in the presence of mitochondria. A, emission spectrum of DAPI was first collected after addition of rat liver mitochondria and again from the same sample following stimulation by 5 mm succinate in the presence of 5 μm rotenone. B, emission spectrum of DAPI was first collected after addition of mitochondria and again following the addition of various amounts of synthetic poly P. C, normalized fluorescence along with results of Gaussian fits obtained by subtraction of spectrum shown on panel A of stimulated mitochondria minus control mitochondria (gray lines) and B, mitochondria in the presence of 150 ng of poly P minus control mitochondria (black lines). Samples were excited at 415 nm wavelength.

