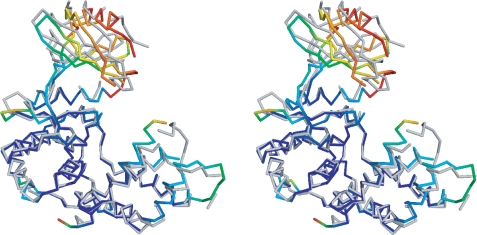
FIGURE 3.
Stereo image of the comparison of the open and closed conformations of APH(9)-Ia. Representative open (apo, monomer A) and closed (nucleotide-bound) conformations of APH(9)-Ia are superposed using residues 108–323. The open conformation in backbone representation is colored in gray. The degree of movement in the main chain atoms as the enzyme shifts from open to closed conformation upon the binding of the nucleotide is demonstrated by a rainbow gradient of colors ranging, where blue represents no significant displacement and red represents displacements greater than 8 Å between corresponding main chain atoms. Root mean square deviation values were not calculated for sections of the structures not modeled in either the apo or AMP-bound APH(9)-Ia.

