FIGURE 5.
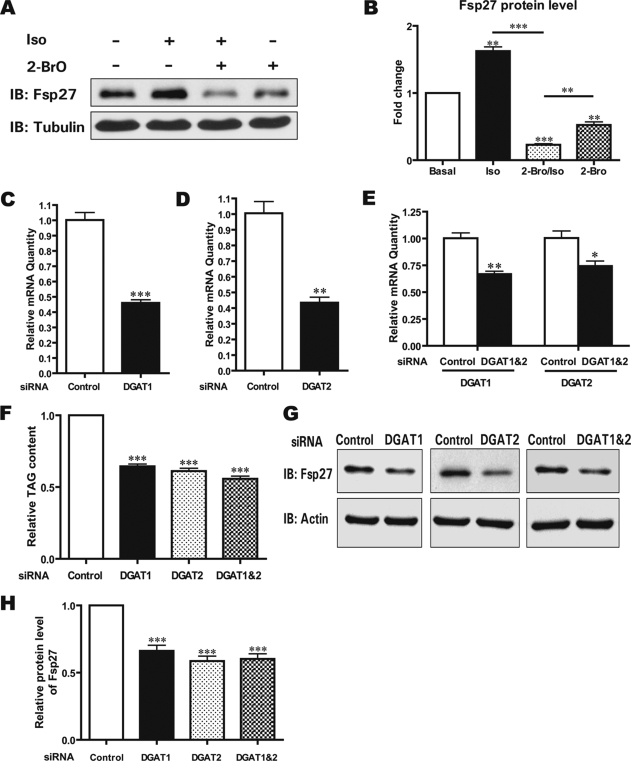
Fsp27 accumulation is dependent on DGAT activity. A, Iso-induced Fsp27 accumulation is dependent on DGAT activity. Differentiated 3T3-L1 adipocytes were treated with Iso alone (lane 2), 2-BrO (1.2 mm) alone (lane 4), or both (lane 3) for 1 h and then harvested to determine the Fsp27 level. B, quantitative analysis of the Fsp27 level in A. A Student's two-tailed t test (unpaired) was used for statistical analysis (***, p < 0.001; **, p < 0.01, n = 3). C and D, knockdown of DGAT1 or DGAT2 in adipocytes. Differentiated 3T3-L1 adipocytes (5 days after induction) were transfected with 200 nm siRNA specific for DGAT1 or DGAT2 using Lipofectamine 2000. Two days after transfection, total RNA was extracted, and the mRNA level of DGAT1 or DGAT2 was evaluated using quantitative real-time PCR analysis. A Student's two-tailed t test (unpaired) was used for statistical analysis (**, p < 0.01; ***, p < 0.001, n = 3). E, knockdown of both DGAT1 and DGAT2 in adipocytes. The DGAT1- and DGAT2-specific siRNAs were mixed together and transfected into differentiated 3T3-L1 adipocytes (5 days after induction). Two days after transfection, the mRNA level of DGAT1 and DGAT2 was evaluated as described in C and D. A Student's two-tailed t test (unpaired) was used for statistical analysis (*, p < 0.05; **, p < 0.01, n = 3). F, reduced total TAG content in differentiated 3T3-L1 cells following the depletion of DGAT1 and DGAT2 alone or DGAT1 and DGAT2 in combination. Two days after siRNA transfection, total cellular lipids were extracted, and the amount of TAG was evaluated using TLC. A Student's two-tailed t test (unpaired) was used for statistical analysis (***, p < 0.001, n = 3). G, Fsp27 accumulation is reduced in DGAT1 and DGAT2 knockdown 3T3-L1 adipocytes. H, quantitative analysis of the Fsp27 level from G. A Student's two-tailed t test (unpaired) was used for statistical analysis (***, p < 0.001, n = 3).

