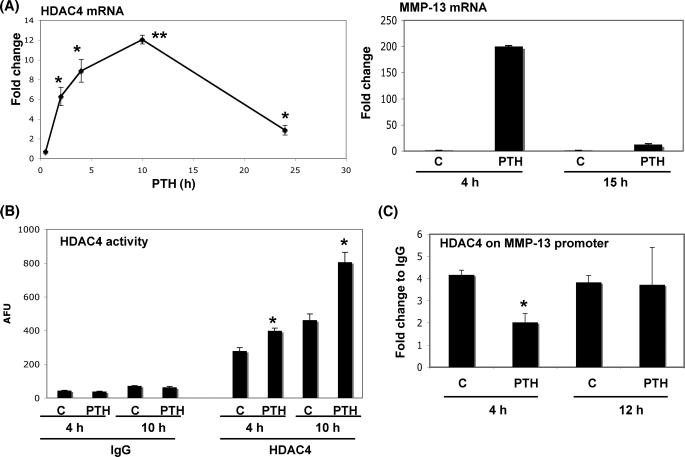
FIGURE 4.
PTH stimulates HDAC4 gene expression and enzymatic activity. A, left panel, total RNA was extracted from UMR 106-01 cells treated with PTH (10−8 m) for 2, 4, 10, and 24 h. Right panel, total RNA was extracted from UMR 106-01 cells treated with PTH (10−8 m) for 4 and 15 h. RNAs were measured using Real time RT-PCR. The relative levels of mRNAs were normalized to β-actin and then expressed as fold stimulation over control. The error bars represent ± S.E. of three independent experiments. *, p < 0.05; **, p < 0.001, significant increase compared with control. B, UMR 106-01 cells were stimulated with PTH (10−8 m) for 4 and 10 h. The samples were examined using HDAC enzymatic assay. *, p < 0.01, significant increase compared with respective control. C, UMR 106-01 cells were treated with control or PTH (10−8 m) for 4 and 12 h. After immunoprecipitation of the cross-linked lysates with anti-HDAC4 or with rabbit IgG as a negative control, the DNA was subjected to PCR with primers that amplify the distal RD and proximal AP-1 sites of the rat MMP-13 promoter. Input DNA (1:100) is a positive control for the assay. The error bars represent ± S.E. of three independent experiments. *, p < 0.001 versus respective control. AFU, arbitrary fluorescence units.

