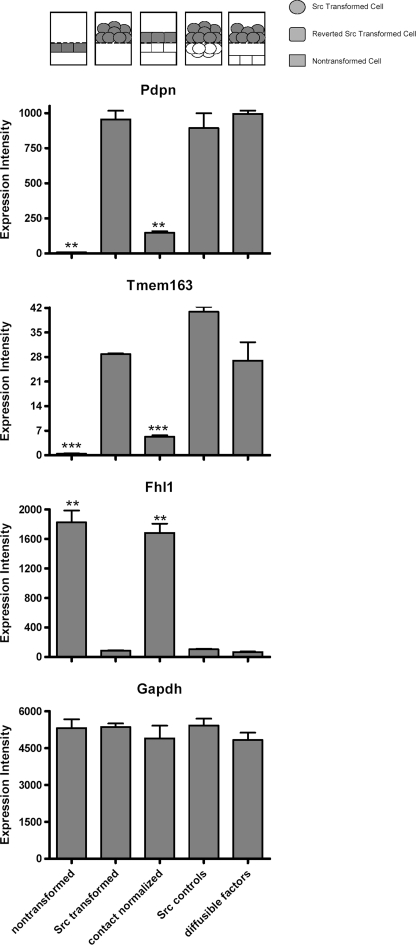
FIGURE 3.
Effects of Src and contact normalization on Pdpn, Tmem163, Fhl1, and GAPDH mRNA expression examined by microarrays. Src-transformed cells were cultured on porous membranes directly above nontransformed cells (contact normalized), directly above another layer of transformed cells (Src controls), or 1 mm above nontransformed cells (diffusible factors). Nontransformed and Src-transformed cells were also plated alone. Each cell layer was separately harvested and analyzed by Affymetrix expression microarrays to detect mRNA species as indicated. Data are shown as expression intensity from microarray analysis (mean ± S.E., n = 2). Configuration of cells in the layered culture system is presented on the top of the histograms, with the target cells filled in gray. Double and triple asterisks indicate p < 0.01 and p < 0.001 compared with Src-transformed cells by t test, respectively.

