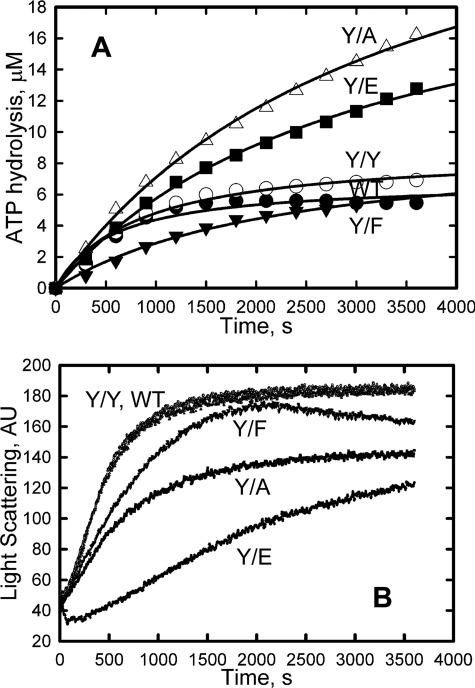
FIGURE 6.
ATP hydrolysis accompanying polymerization. A, ATP hydrolysis. B, polymerization. The time course of polymerization was followed by the increase in light scattering, and the time course of ATP hydrolysis was followed by an assay of Pi release (see “Experimental Procedures”). Actin concentrations were as follows: WT, Y/Y, and Y/F, 6 μm; Y/A and Y/E, 8 μm. AU, arbitrary units.

