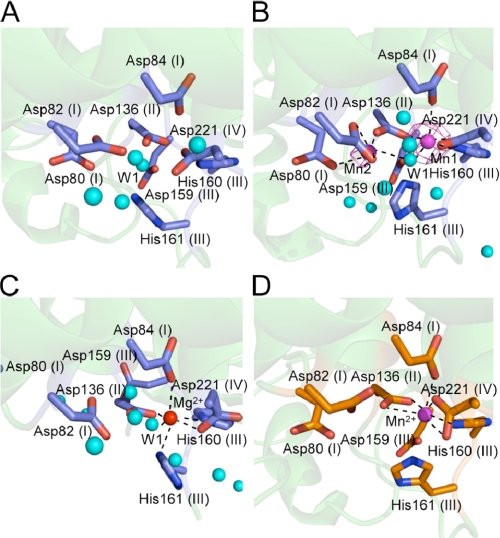
FIGURE 3.
Metal ion-binding site. A, intact ttRecJ ligand-free form. B, Mn2+ ion-binding sites in intact ttRecJ. Electron density (magenta) of the Mn2+ ions derived from an anomalous difference Fourier map (λ = 1.70000 Å) is superimposed on the model. The position of the Mn2+ ion is shown by a magenta sphere. Water molecules are shown by cyan spheres. C, Mg2+ ion-binding site in intact ttRecJ. The position of the Mg2+ ion is shown by a red sphere. D, Mn2+ ion-binding site in cd-ttRecJ (Protein Data Bank code 1IR6). The position of the Mn2+ ion is shown by a magenta sphere. Wat1 (W1) is assumed to be the nucleophilic water. The motif names are indicated in parentheses. The dashed lines show the coordination with the metal ion.

