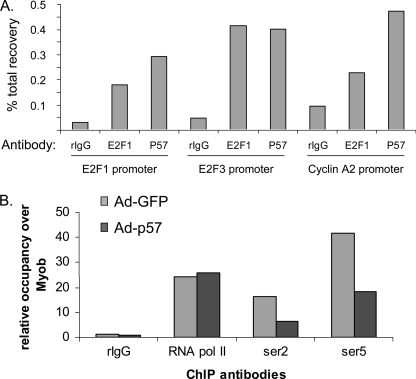
FIGURE 4.
ChIP assays indicate that E2F1 and CDKN1C coexist in complexes on the E2F1, E2F3, and cyclin A2 promoters. A, H1299 cells were treated with either Ad-GFP or Ad-p57 for 48 h as indicated. Quantitative ChIP assays were performed on the E2F1, E2F3, and cyclin A2 promoters using antibodies as indicated on the x-axis. “IgG” represents a negative control (Santa Cruz Biotechnology, sc-1027). E2F1 represents E2F1 antibody (Santa Cruz Biotechnology, sc-193). “P57” represents CDKN1C antibody (Santa Cruz Biotechnology, sc-1040). Results were normalized to % total recovery from the input chromatin. B, quantitative ChIP assays on the E2F3 promoter were performed using antibodies against various RNA pol II phospho-isoforms. Additionally, in this experiment results were normalized to relative occupancy over the occupancy of the myoglobin B intron.

