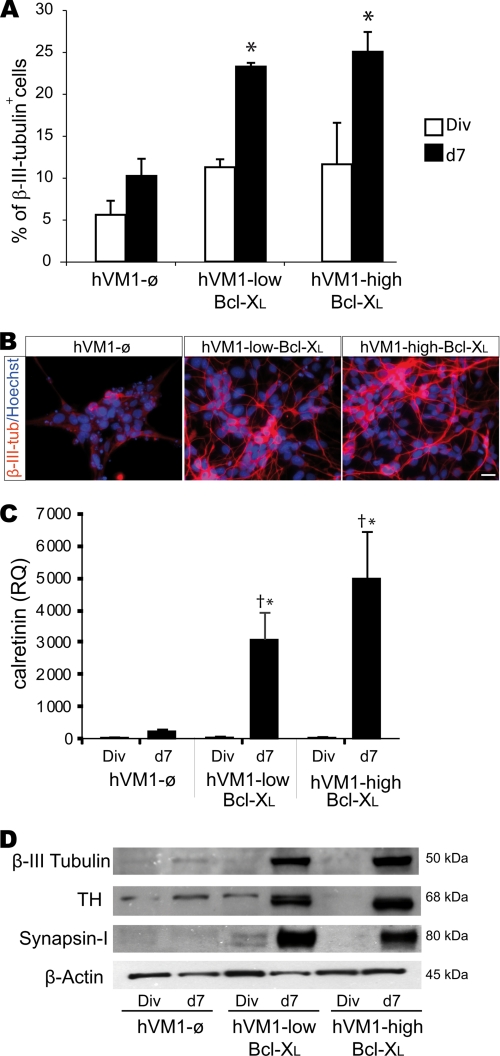
FIGURE 4.
Bcl-XL effects on neuron and DAn generation by hVM1 cells. hVM1-ø- or Bcl-XL-overexpressing cell lines were analyzed under proliferation (Div) or after 7 days of differentiation (d7). A, percentage of β-III-tubulin+ cells was determined by ICC in double-stained β-III-tubulin and Hoechst cultures. Data represent mean ± S.E. (n = 3) (p < 0.05, Kruskal Wallis ANOVA, post hoc Mann-Whitney U test; *, versus hVM1-ø cells). B, ICC for β-III-tubulin in 7-day differentiated cells. Scale bar, 20 μm. C, quantitative analysis of CALRETININ expression in control and Bcl-XL-overexpressing cells. Data represent mean ± S.E. (n = 3) and were normalized to GAPDH gene expression. RQ is in relation to hVM1-ø cells under division conditions. (p < 0.05, ANOVA, post hoc Fisher test; *, versus hVM1-ø cells; †, versus Div). D, Western blots of control, hVM1-low Bcl-XL, and hVM1-high Bcl-XL cells under division or differentiation conditions. Blots were stained for β-III-tubulin, TH, synapsin-I, and β-actin.

