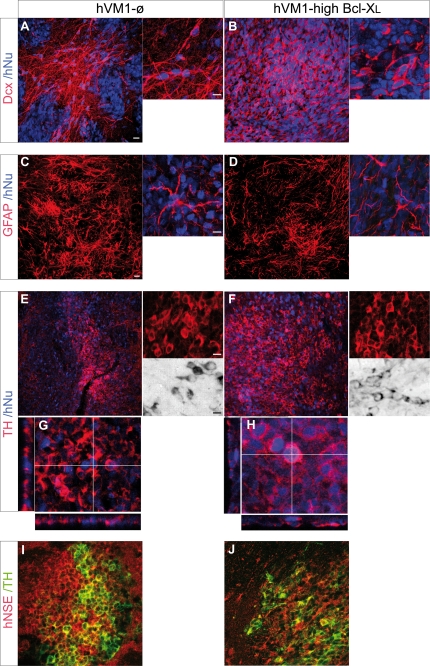
FIGURE 9.
Cellular analyses of the transplants. Transplants were stained for Dcx (A and B), human GFAP (C and D), TH (E–H), and hNSE (I and J) (and counterstained with hNu). For each staining, both low magnification (left) and a high power image (right) are shown. For TH immunohistochemistry, DAB-stained cells are shown in E and F, and orthogonal projections are shown, confirming the colocalization of TH and hNu (G and H). Scale bars in low magnification images, 20 μm; scale bar in the high power image, 10 μm.

