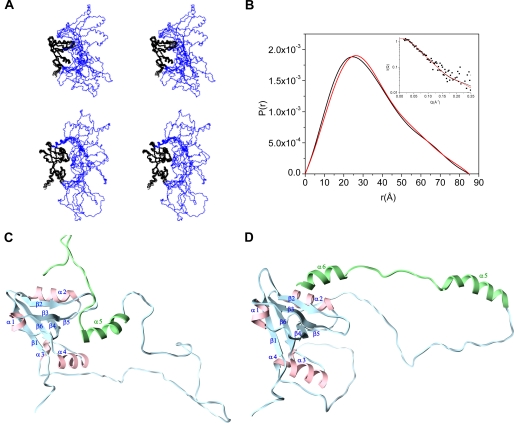
FIGURE 7.
Structural model of the intact PDZ2CT from NMR refined against SAXS. A, stereoview of the ensemble NMR structures of PDZ2CT after refinement against SAXS. The backbone of the PDZ2+270 domain is shown in black, and the CT domain is shown in blue. Top, the C-terminal EB region is shown in random coil conformation. Bottom, the C-terminal EB region is shown in helix conformation. The images were generated in MOLMOL 2.1 (68). B, length distribution functions P(r) calculated from the NMR structure of PDZ2CT with the EB region adopting helix conformation (red) or random coil conformation (black). The inset shows the fits of the calculated scattering profiles from the NMR structures to the experimental SAXS data (filled squares), with the EB region adopting a helix (red) or random coil (black) conformation. C, a representative ribbon structure of the intact NMR structure of PDZ2CT from A. The C-terminal domain includes the single N-terminal helix (residues 323–334) and the EB region that adopts a random coil conformation. D, a representative ribbon structure of PDZ2CT with the C-terminal EB region adopting a helical conformation and docked into the PDZ2 domain via Leu358.

