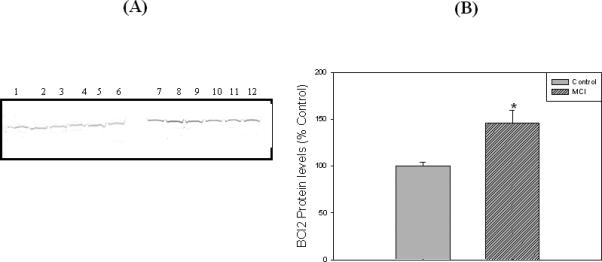
Figure 4.

‘A’ represents Western blot of hippocampal BCl2 protein levels in MCI and age-matched controls. ‘B’ represents histogram of BCl2 blot. Lanes 1-6 represent control hippocampus, and lanes 7-12 represent MCI hippocampus. See text for details. Data are shown as Mean ±S.D. n=6 , * p<0.05.
