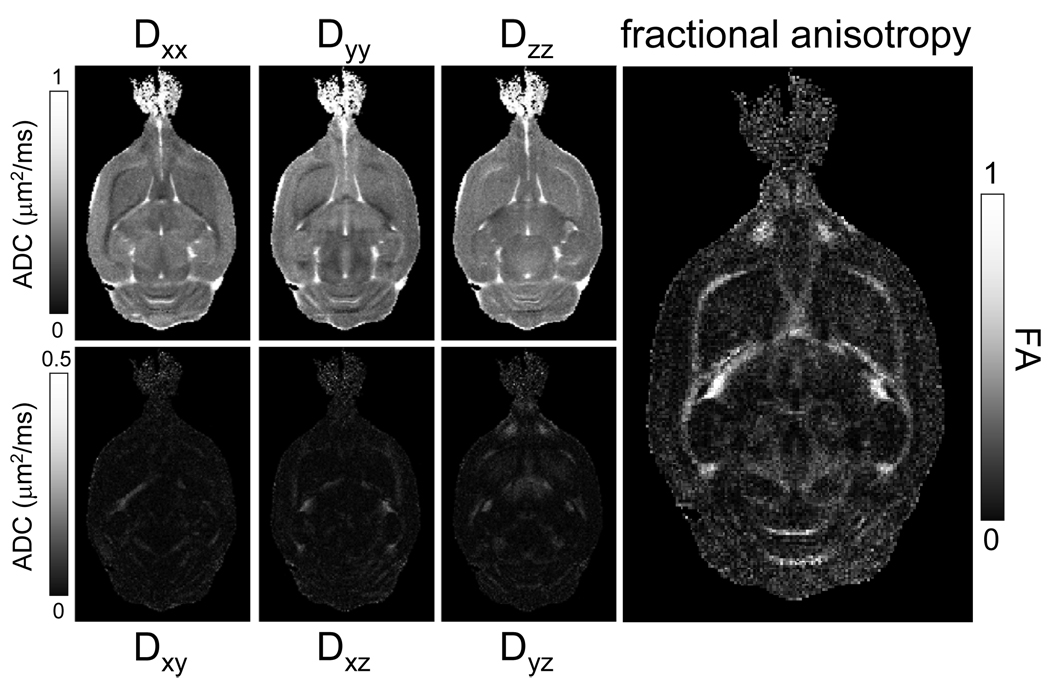
Figure 2.
Diffusion tensor imaging (DTI) on microwave-fixated rat brain. Data was acquired at a 120 × 120 µm in-plane resolution over 1000 µm thick slices. Diffusion maps were calculated using a SVD over 14 experiments (13 directions, b-value = 1.4 ms/µm2 and 1 image with b = 0 ms/µm2). White matter anisotropy is clearly visible in all six directional diffusion maps. This is further emphasized in the fractional anisotropy (FA) map, calculated from the three eigenvalues of the diffusion tensor. Excellent contrast between gray matter (FA ~ 0.2) and white matter (FA > 0.6) is visible.

