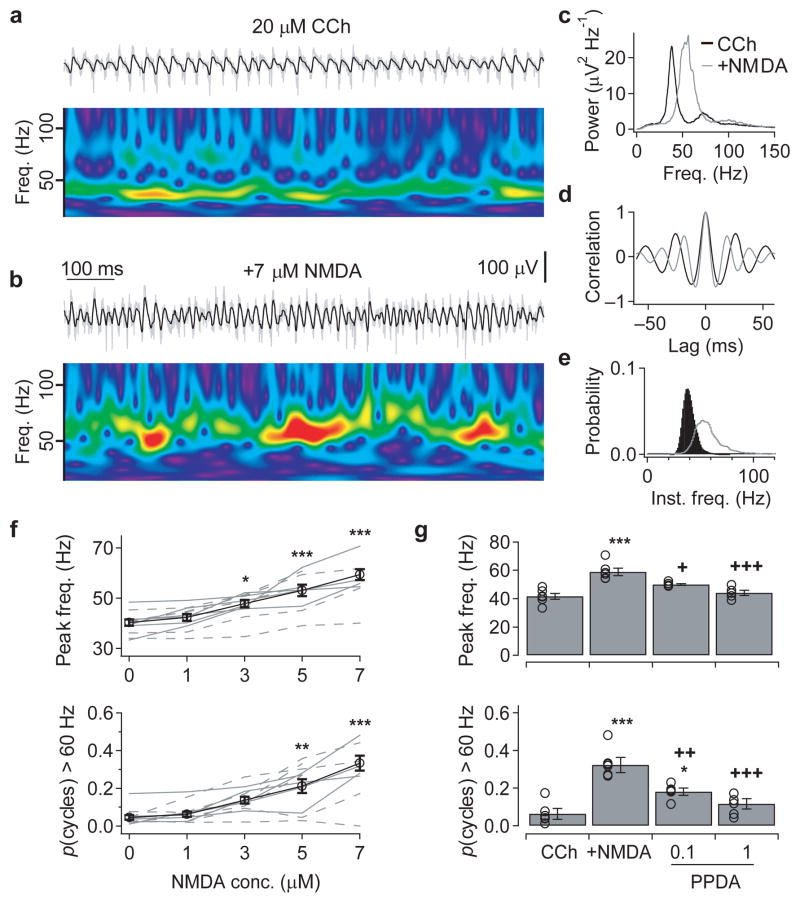
Figure 4. Activation of NMDAR increases the frequency of cholinergically-induced γ oscillations in juvenile slices.
(a&b) To explore further the mechanisms underlying the frequency-modulation of γ oscillations, network activity was recorded in the submerged recording configuration, but it was only possible to induce oscillations in juvenile (P14–21) slices. Under these conditions, cholinergic activation (20 μM carbachol) induced oscillations in the low γ-frequency range in both Gabrd−/− and wildtype slices (a), but additional exogenous application of NMDA induced epochs of higher-frequency γ oscillations (b). The upper traces show the field recording from the CA3 pyramidal cell layer band-passed between 15 and 120 Hz (black), superimposed on the raw trace (grey). The wavelet spectrum below shows the oscillation frequency over time (warmer colors indicate higher power, with same color scale used in both panels). (c-e) The NMDA-evoked increase in oscillation frequency, from the experiment shown in a&b, compared using the power spectral density (c), auto-correlation (d) and histogram of the instantaneous cycle frequency (e). (f) Exogenous NMDA application (1–7 μM) produced a concentration-dependent increase in peak oscillation frequency (upper) and the proportion of cycles with an instantaneous frequency above 60 Hz (lower) (solid lines: Gabrd−/−, dashed lines: wildtype; data combined for averages). (g) The 7 μM NMDA-evoked increases in oscillation frequency were blocked by the PPDA in a concentration-dependent manner. (*p < 0.05, **p < 0.01, ***p < 0.001 cf. control, +p < 0.05, ++p < 0.01, +++p < 0.001 cf. 5–7 μM NMDA, One-way ANOVA followed by unpaired t-test). Error bars represent s.e.m.

