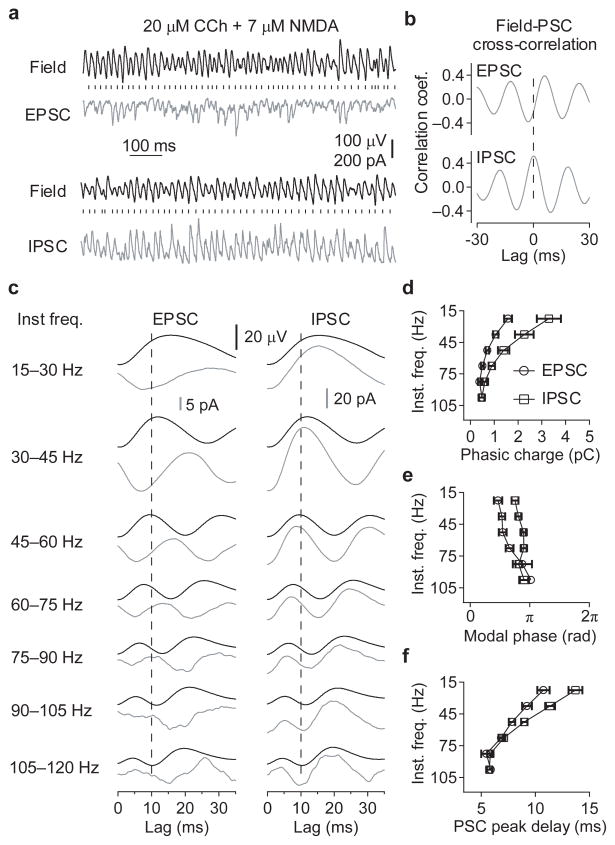
Figure 6. The lag between synaptic inhibition and excitation disappears as the γ oscillation frequency increases.
(a) Representative traces showing the relationship between the field potential recorded from the CA3 pyramidal cell layer and the EPSCs and IPSCs recorded from a CA3 pyramidal neuron, during oscillations induced by co-application of 20 μM carbachol and 7 μM NMDA. The vertical dashes represent the zero phases (negative peaks) of the oscillation in the field potential. (b) Cross-correlations between synaptic currents and the field potential, showing that on average the EPSCs occur earlier in field potential oscillation cycle than the IPSCs. Dashed line represents zero lag. (c) Averages of the EPSC and IPSCwaveforms (grey), and corresponding field potential waveforms (black), triggered on the negative peak of the field potential oscillation, and separated into 15 Hz bins of according to instantaneous frequency. The polarity of the PSCs is the same as (a), with negative peaks in the EPSCs and positive peaks in the IPSCs. Data are combined from 11 recordings, with NMDA concentrations from 1–7 μM M to induce different γ oscillation frequencies. The vertical dashed lines mark a lag of 10 ms. (d-f) Charge transfer per oscillatory cycle (d), the modal phase of the peak synaptic current (e), and lag of the peak synaptic current after the negative peak in field oscillations (f), binned as in (c). (n = 5–11, *p < 0.05, **p < 0.01, ***p < 0.001 EPSC vs IPSC, Two-way ANOVA followed by unpaired t-test; +p < 0.05, ++p < 0.01, +++p < 0.001 EPSC vs IPSC, Watson-Williams test). Error bars represent s.e.m.

