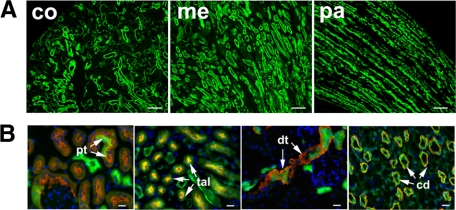
Figure 2.
Renal tubular expression of EYFP in control Creksp;R26R-EYFP mice. A: Low power views of EYFP expression (green) in renal cortex (co), medulla (me) and papilla (pa). Scale bar = 50 μm. B: EYFP (green) is expressed in proximal tubules (pt) stained with LTA (red), and other nephron segments with antibodies to Na-K-Cl co-transporter (red) for thick ascending limbs (tal), NCX1 (red) to distal tubules and connecting tubules (dt), and AQP3 (red) to collecting ducts (cd). Scale bar = 20 μm.

