Figure 8.
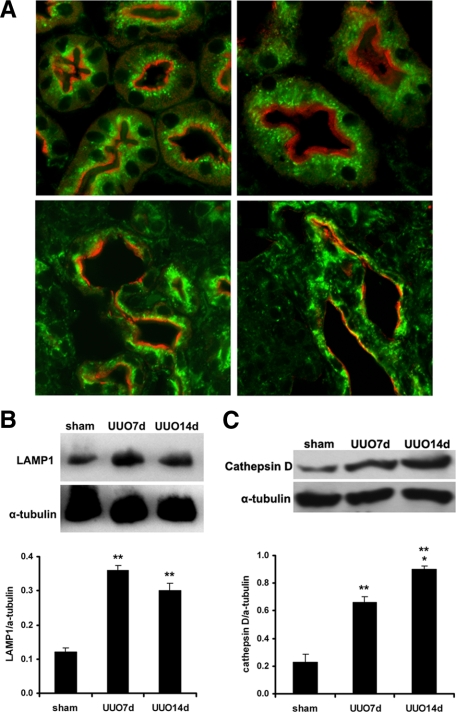
Expression of lysosomal membrane protein LAMP-1 and lysosomal enzyme cathepsin D. A: Co-immunostaining of LAMP-1 (green) and proximal tubular marker LTA (red) indicates abundant LAMP-1 signals in a small punctate pattern in proximal tubules in controls (left upper image) and 3 days post UUO (right upper image). LAMP-1 signals become enhanced and are in a coarse and granular pattern 7 days (left lower image) and 14 days (right lower image) post UUO. B: Immunoblot analysis indicates increased LAMP-1 protein levels post UUO. C: Immunoblot analysis indicates increased cathepsin D protein levels post UUO. Values represent mean ± SE. n = 3 for each experimental group. **P < 0.001 between sham and 7 days or 14 days post UUO.

