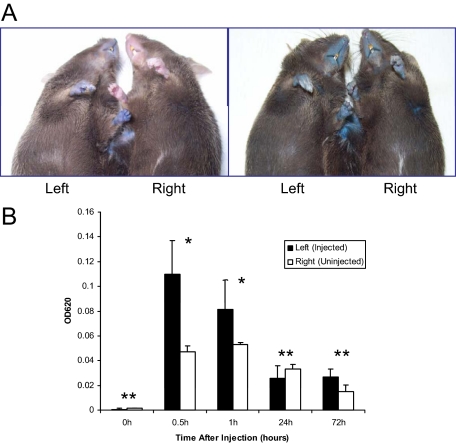
Figure 2.
Documentation of shared circulation between the parabiotic animals by using Evans blue. A: Photographs of the mice were taken 5 minutes (A, left) and 24 hours (A, right) after the injection of Evans blue into the tail vein of the parabiotic mouse on the left side at 7 weeks after surgery. Photographs illustrate that Evans blue stained both mice at 24 hours after injection. B: The serum concentrations of Evans blue in both mice in each pair were measured at 620 nm by using spectrophotometry at 0, 0.5, 1, 24, and 72 hours after injection. Evans blue dye appeared in the contralateral mouse at 0.5 hours, and the concentrations in serum were equalized between the injected and noninjected mice at 24 and 72 hours after injection, even though the total amount of Evans blue in the circulation was reduced at that time point as compared with earlier time points. The values are mean ± SE, n = 4. Statistical difference between the injected and noninjected mice was noted at the time points of 0.5 and 1 hour (*P < 0.01, Wilcoxon test), but not at the 0, 24, and 72 hours (**P > 0.01, Wilcoxon test).

