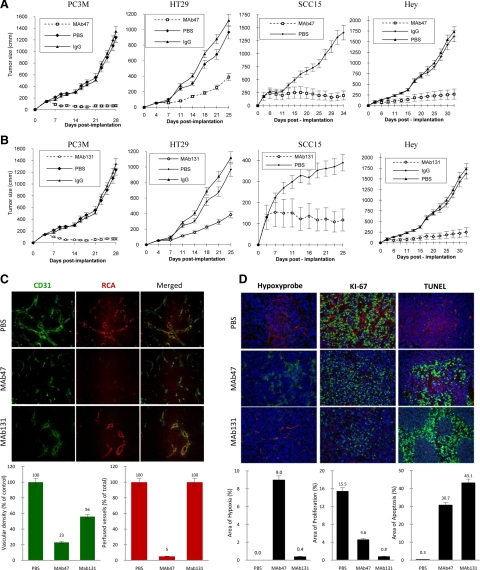
Figure 3.
Human tumor xenograft studies in vivo. A and B: Mice were implanted subcutaneously with EphB4-positive cell lines; mice with established tumors were randomized to different treatment groups. Tumor volumes over time after treatment with MAb47 (A) or MAb131 (B) are shown. Controls include PBS or isotype specific IgG. C: Analysis of HT29 tumor tissues harvested after therapy. Representative data for vessel density (CD31 staining in green), vessel perfusion (RCA in red), and merged images (×20) are shown. Quantification of vessel density and perfusion was done using Bioquant image analysis. Data are presented as mean ± SE. D: Tissue analysis of HT29 tumors was performed for areas of hypoxia (green), proliferative index by Ki-67 staining (green), and apoptosis by TUNEL assay (green). Perfused vessels were identified by RCA localization (red). Quantification of areas of hypoxia, proliferation, and apoptosis was done using Bioquant image analysis (×20). Data are presented as mean ± SE.

