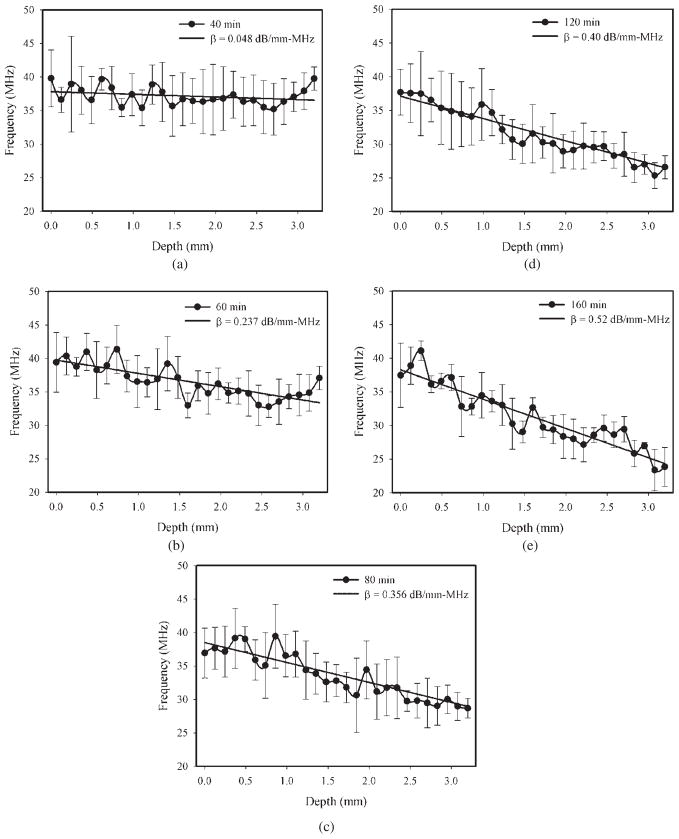
Figure 6.
The center frequency location as a function of depth at different stages of the cataract lens. The liner fit was used to estimate the slope of Δ f̄/Δd. The measurements were carried out at the immersion times of 40 (a), 60 (b), 80 (c), 120 (d) and 160 min (e). Data are mean and SD values (N = 6).

