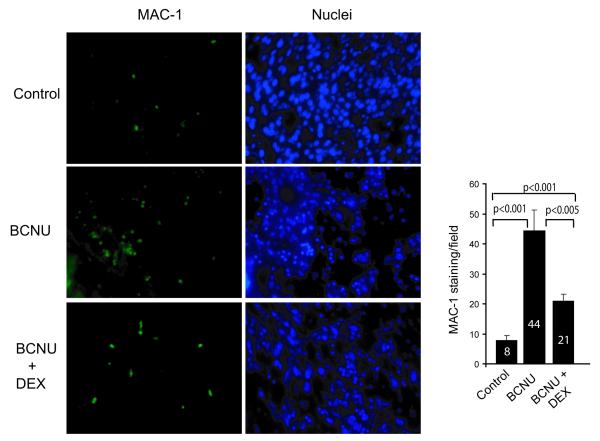
Figure 5. MAC-1 staining in tumor micrographs.
Immunofluorescence staining of control, BCNU treated and BCNU plus dexamethasone treated tumors was performed using on MAC-1 antibody. A representative immunofluorescence micrograph for each group is shown. The number of cells positive for Mac-1 signal within tumor were counted per field. At least two sections per tumor were stained. Each group had a minimum of four animals. The Students t-test showed that the difference between the control and BCNU, control and BCNU+DEX or BCNU and BCNU+DEX was significant for the MAC-1 positive cells.

