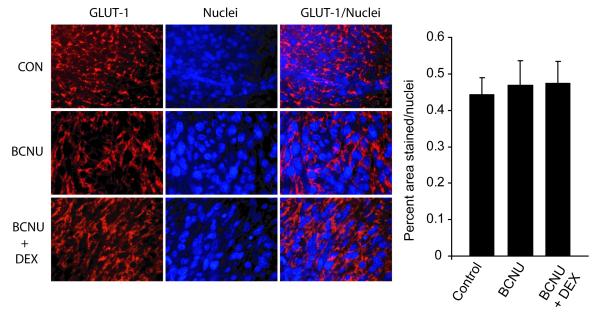
Figure 6. GLUT-1 staining in tumor micrographs.
Immunofluorescence staining of control, BCNU treated and BCNU and Dexamethasone treated tumors was performed using a GLUT-1 antibody. A representative immunofluorescence micrograph for each group is shown. Bar graph depicts the quantification of the results for each treatment group from four animals per group with at least 2 sections per animal and 2 fields per section.

