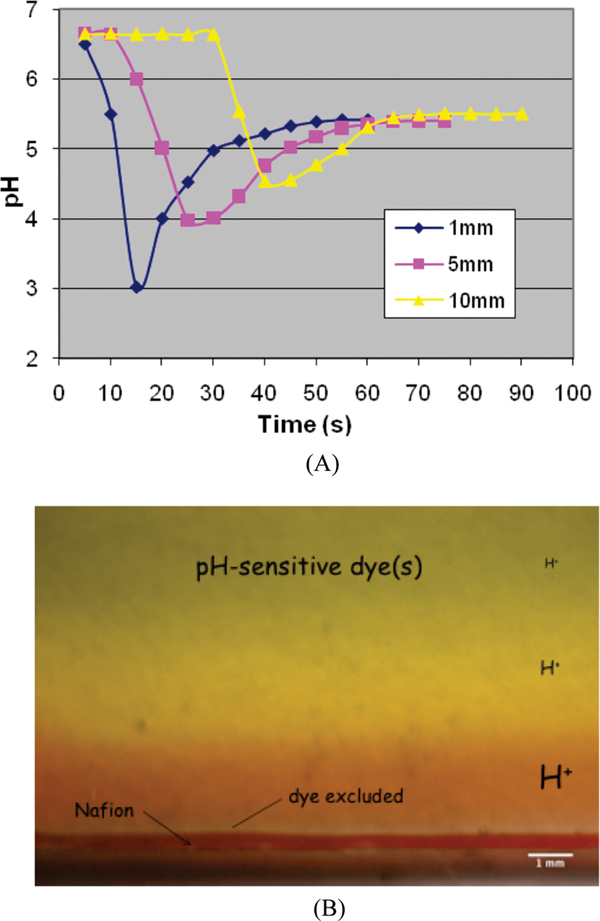
Figure 1.
(A) Time course of pH change following addition of water to Nafion sheet. Values of pH were measured at 5 s intervals using a miniature pH probe positioned at three distances from the Nafion surface, as indicated in the legend. A wave of protons is generated as the EZ forms, giving lower pH. At a distance of 1 mm, the pH drop transiently exceeds 3 pH units, which represents a H+ increase in excess of 1000 times. (B) Chamber containing Nafion tube (bottom) filled with water containing pH-sensitive dye. The view is normal to the wide face of a narrow chamber. The image obtained 5 min after dye-containing solution was added to Nafion. The red color indicates pH < 3; the colors above indicate progressively higher pH levels, with near neutrality at the top.

