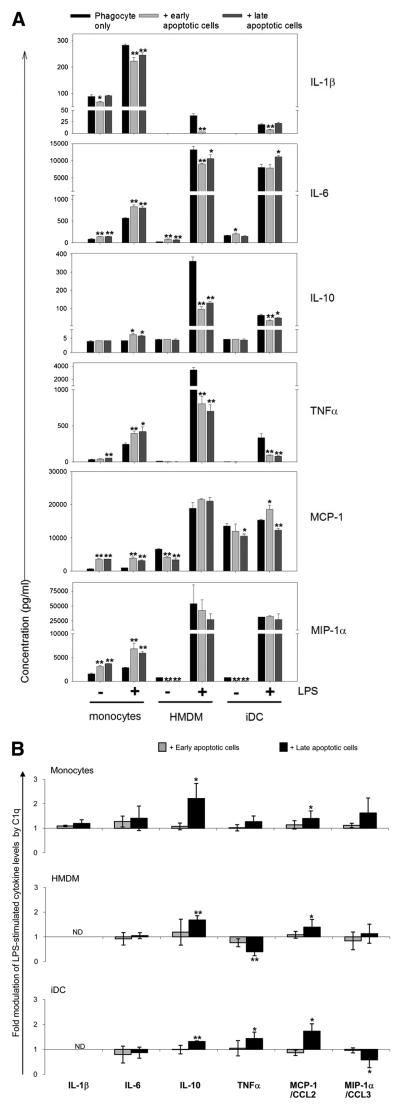
FIGURE 6.
C1q modulation of cytokines released from phagocytes during the uptake of apoptotic cells. A, Cytokine levels were measured by Luminex multiplex analysis of the supernatant of monocytes, HMDMs, or iDCs from the same donor, plated on LabTek chamber slides, and fed early or late apoptotic cells as described in Materials and Methods and stimulated with 0 or 30 ng/ml LPS for 18 h. Data are the average concentrations ± SD from measurements of triplicate wells from a single experiment, representative of three. B, Cytokine levels were measured in the supernatant of monocytes, HMDMs, or iDCs, which had been incubated with early or late apoptotic cells opsonized with 300 μg/ml C1q for 30 min and subsequently stimulated with 30 ng/ml LPS for 18 h. Results are expressed as fold difference in expression compared with control levels from LPS-stimulated phagocytes, which had ingested apoptotic cells in the absence of C1q. Data are plotted as average fold differences ± SD from three experiments. *, p < 0.05; **, p < 0.005, C1q-treated levels vs control levels in the absence of C1q, Student's t test.

