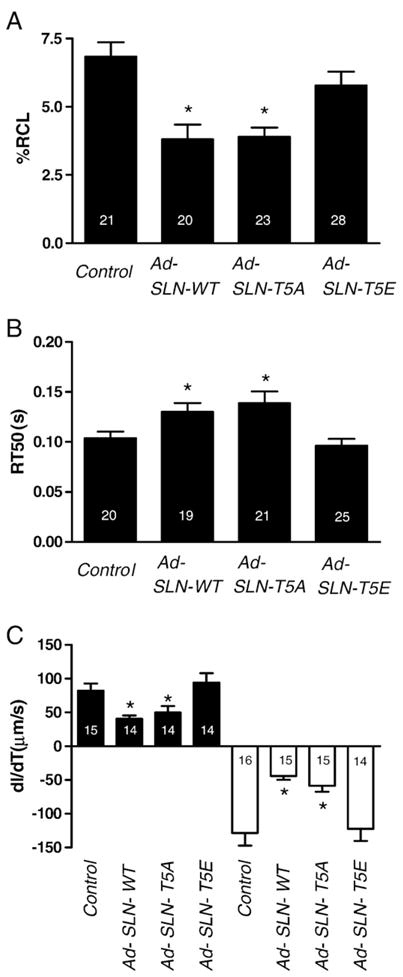
Fig. 3.

Mutation of T5 alters myocyte contractility— contraction amplitude (A) and time to 50% relaxation (B) in control myocytes and myocytes infected with Ad.SLN-WT, Ad. SLN-T5A or Ad.SLN-T5E adenovirus. (C) Rates of shortening (+dL/dT) are represented on the positive axis (closed bars) and relaxation (−dL/dT) on the negative axis (open bars). Myocyte contractility was analyzed after 48 h by pacing at 1 Hz. *Significantly different from control myocytes (p<0.05). Number of cells (N) indicated within each bar graph.
