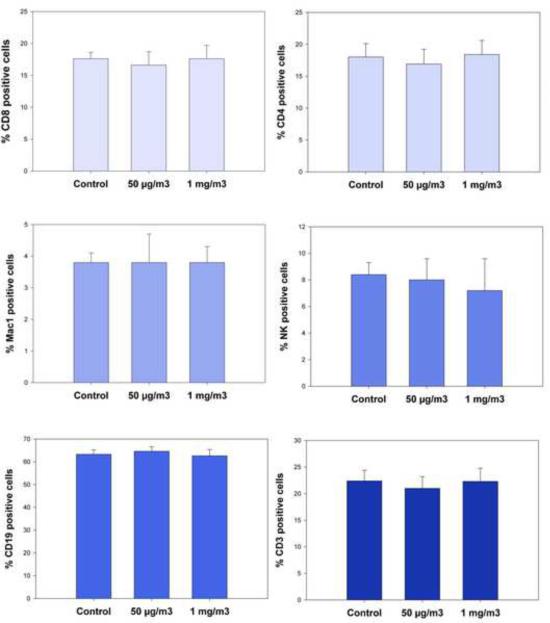
Figure 2.
Cell surface phenotype analysis following 14 day ATO inhalation exposures (3 hrs per day) at 50 μg/m3 and 1 mg/m3 compared to air in male C57BL/6 mice. CD45+ spleen cells were examined for surface markers for cytotoxic T cells (CD8+), helper T cells (CD4+), macrophages (Mac-1), NK cells (CD16+), total B cells (CD19+), and total T cells (CD3+). Results shown are the averages for individual determinations from 7 mice ± SEM.

