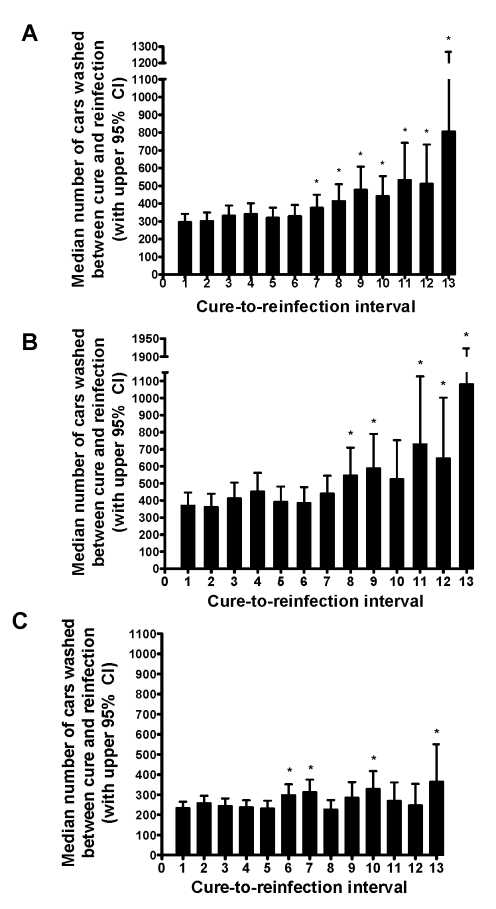
Figure 7. Median number of cars washed between each cure and subsequent reinfection in car washers.
The median number of cars washed between each cure and subsequent reinfection (and corresponding 95% confidence intervals) was estimated with the LIFRREG procedure in SAS. Figures represent total cohort of car washers (A) and cohort stratified into resistant (B) and susceptible (C) phenotypes. “Cure-to-reinfection interval 1” is the interval between the first cure after study entry and the first reinfection following the first cure, “cure-to-reinfection interval 2” is the interval between the second cure and second reinfection, and so forth. *Length of interval significantly greater than first cure-to-reinfection interval.

