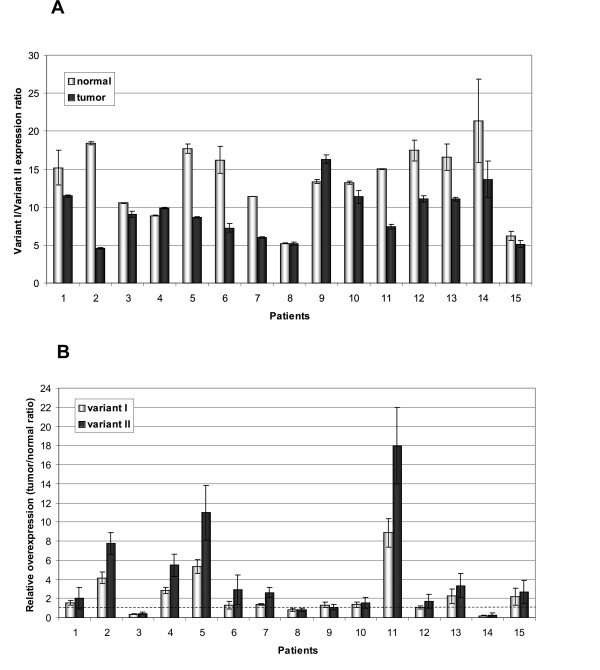
Figure 5.
Quantitative analysis of the expression of HAX1 variants I and II. A. Expression of variant I is significantly higher than variant II, in both, normal and tumor tissues, but variant I/variant II expression ratio is higher in normal tissues (median 15) than in tumors (median 9), due to a relatively higher overexpression of variant II in tumors. B. Relative overexpression measured for variant I and variant II, calculated as a tumor/normal ratio. Overexpression, (expression higher than 1.5 fold) was found in 47% and 73% of cases for variants I and II, respectively. Dashed line indicates the level of expression in normal tissues. Order of patients according to the stage of the disease.

