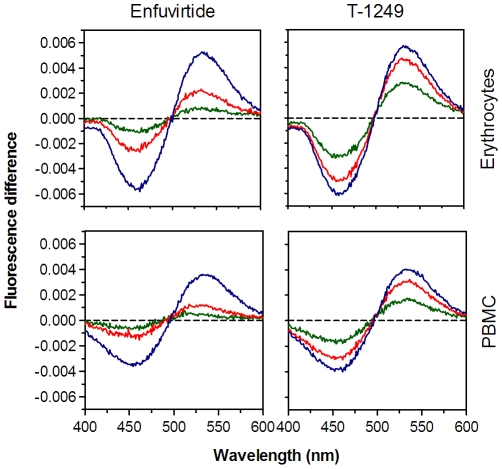
Figure 2. Differential spectra of membrane-bound di-8-ANEPPS in the presence of HIV-1 fusion inhibitor peptides.
The shape of the difference spectra reveal spectral shift to the red, indicative of a decrease in membrane dipole potential. For erythrocytes (top row) and PBMC (bottom row), the higher the peptide concentration (150 µM in blue, 40 µM in red and 10 µM in green), the higher the spectral shifts.

