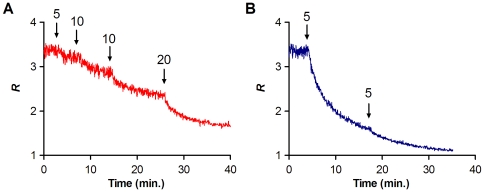
Figure 3. Time course variation of dipole potential in response to the peptides.
The effect of the addition of indicated concentrations (µM) of enfuvirtide (A, red) and T-1249 (B, blue) to labeled erythrocytes was followed by measuring the ratio in real-time. Stepwise additions decreases the ratio within minutes.

