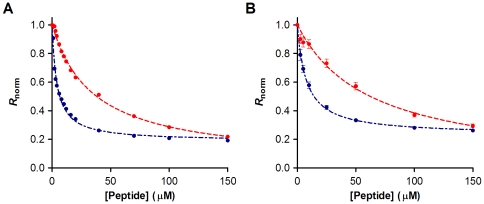
Figure 4. Peptide affinity towards erythrocytes and PBMC cell membranes.
The dependence of the ratio on the enfuvirtide (red) and T-1249 (blue) concentrations for erythrocytes (A) and PBMC (B) was analyzed by a single binding site model (dashed lines) in order to quantify the dissociation constants (see Table 1). Ratio values were normalized for the initial value of zero peptide concentration. Plotted values represent the mean ± SEM (error bars not visible in erythrocytes due to small errors). N = 6 for erythrocytes and N = 7 for PBMC.

