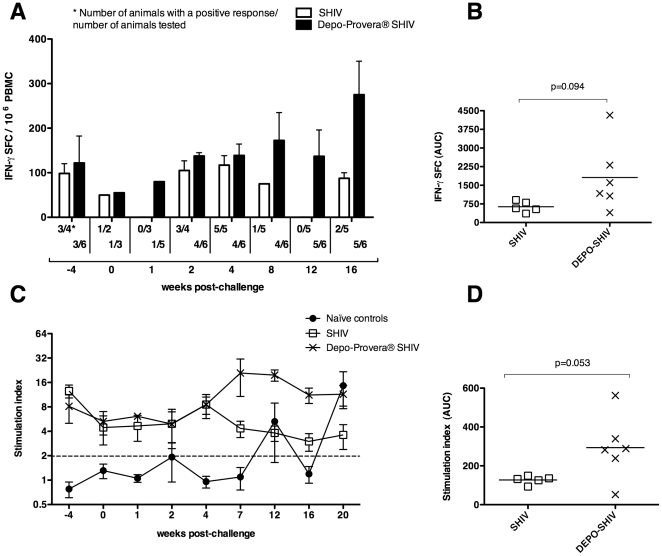
Figure 3. SIV-specific T cell responses after IV SIVmac239 challenge.
(A) Mean number of SIV Gag p27 interferon (IFN)-γ secreting cells in PBMC before and after challenge. (B) Median area under the curve for the total IFN-γ secreting cells in each group from week 2 to 16 PC, the time-points for which samples were available. (C) Mean SIV-specific T cell proliferative responses in PBMC expressed as the stimulation index (SI) before and after SIV challenge. See Methods for details. (D) Median area under the curve for the cumulative SI in each group from week -4 to 20 PC. (λ) Naïve control macaques (n = 7), (○) SHIV-immunized macaques (n = 5) and (5) Depo-Provera® SHIV-immunized macaques (n = 6). P values of a T test are indicated.

