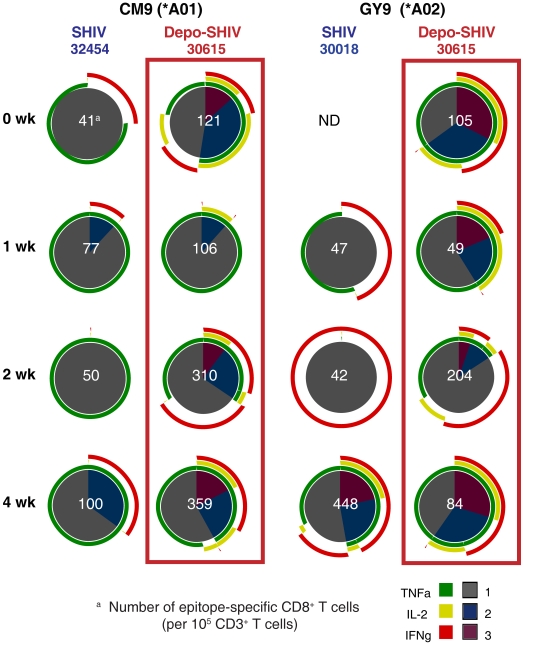
Figure 4. Frequency and functional capacity of Gag CM9- and GY9-specific CD8+ T cells of SHIV-immunized animals after IV SIVmac239 challenge.
SIV-specific CD8+ T cell responses in cryopreserved PBMC from a Mamu-A*01 positive animal and a Mamu-A*02 positive animal in each vaccinated group are shown as pie charts. The number of positive SIV-specific T cells normalized to 105 CD3+ T cells is shown for each response as the white number in the center of the pie chart. Each portion of a pie chart indicates the percentage of SIV-specific T cells that responded with one, two, or three functions; and the colored arcs around the pie show the cytokine or combination of cytokines comprising each response. ND not done, as samples were not available.

