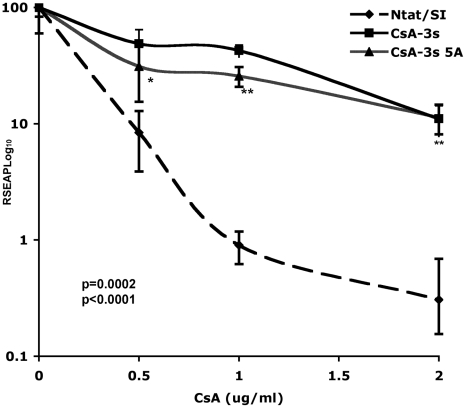
Figure 1. NS5A confers CsA resistance.
Equal numbers of replicon cells were seeded for the Ntat/SI, CsA-3s and CsA-3s 5A cell lines. The cultures were treated with CsA at the indicated concentrations for 6 days. Media was changed on day 6 and CsA was added to the cells again. On day 7, media was collected and assayed for SEAP activity. They axis shows RSEAP Log10 (relative SEAP Log values). Student's t test was used to calculate p values. Ntat/SI vs CsA-3s 5A at 1.0 and 2.0 µg/ml <0.0001; at 0.5 µg/ml is 0.0002.

